Download
1 / 23
230 likes | 405 Vues
TEA-3 Transportation Enhancements & Physical Activity: Policy Implications. Deborah A. Cohen Ross Brownson Henry Feldman. R h e a l t h. Utilitarian Physical Activity Refers to routine activity in the course of one’s daily schedule. Leisure Physical Activity

E N D
TEA-3 Transportation Enhancements & Physical Activity:Policy Implications Deborah A. Cohen Ross Brownson Henry Feldman R h e a l t h
Utilitarian Physical Activity Refers to routine activity in the course of one’s daily schedule Leisure Physical Activity Refers to voluntary activity undertaken in one’s free time for one’s own pleasure or preference. Background
Utilitarian Physical Activity Change environment Passive Acceptable (normative) Sustainable Reach large numbers Leisure Physical Activity Requires active, voluntary participation Motivation issues Less sustainable Difficult to reach large numbers Population-Level Interventions
Utilitarian Person-Trips by Mode and Walking Trips by Residential Location, 2001
The graph above illustrates the percent of active walkers (daily walkers) Transit Use. Roughly 25% of Active walkers take transit twice a week, another 16% once a week, about 12% some, 8% once, and about 7% never. Transit Use is Associated with Daily Walking http://nhts.ornl.gov/2001/presentations/walking/index.shtml
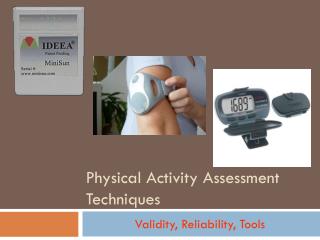
Using Mass Transit Requires Physical Activity On average it is estimated that people walk ten minutes each way to transit stops. Using transit likely results in about an extra 100 Kcal energy expended per round-trip.
Light Rail • Can serve high volume of people daily • e.g. During May 2000 the Los Angeles Long Beach Red line carried over 65,000/day and the Blue line over 60,000/day.
Trend in BMI Trend in VMT Graphics above show that VMT follows closely to Body Mass Index growth from 1969 to 2001. http://nhts.ornl.gov/2001/presentations/walking/index.shtml
Trends in Transportation to Work Source: U.S. Department of Housing and Urban Development, American Housing Survey (Washington, DC: various years).
Gas Prices Vs Gross Domestic Product GDP Gas prices
Gas Prices vs. Vehicle Miles Traveled Economics at the Wheel. The Costs of Cars and Drivers. Richard C. Porter, 1999, Academic Press
Highway expenditures Mass transit expenses Mass transit revenues American Public Transit Association, 2003 Transportation Fact Book, (Washington, DC: 2002),
What is TEA-3? • Third iteration of the Transportation Equity Act. Funds transportation projects: • Highway construction, • Rail service, • Mass transit, • Programs for bicycling and walking (trails, sidewalks, etc.)
29 States with 73+ Ongoing / Proposed Rail Projects Ohio Oregon Pennsylvania Rhode Island Tennessee Texas Utah Vermont Virginia Alaska Arizona Arkansas California Colorado Florida Georgia Hawaii Illinois Kansas Kentucky Louisiana Maryland Massachusetts Minnesota Nevada New Hampshire New Jersey New York North Carolina
These projects provide an opportunity to understand the impact of federal transit spending on the physical activity and health of our population. This type of evidence may help inform public policy in the future.