Download
1 / 58
580 likes | 681 Vues
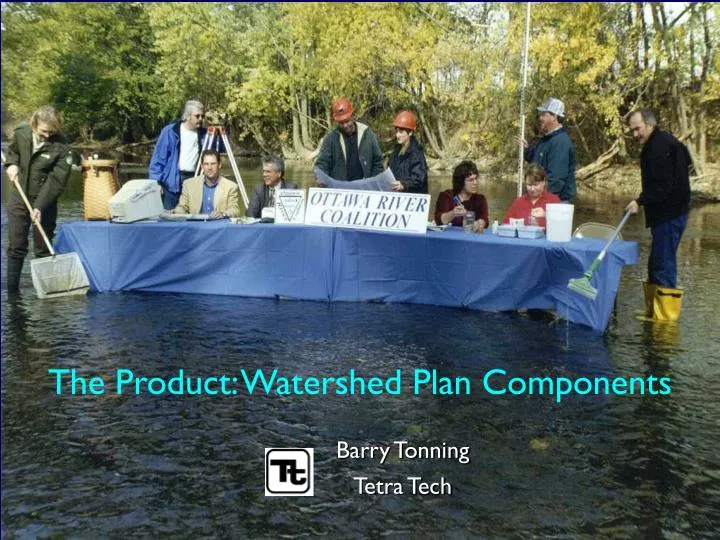
The Product: Watershed Plan Components. Barry Tonning Tetra Tech. Contents of a Watershed Plan. Introduction Plan area & description, partners, background Water quality information & analysis WQ goals, monitoring/assessment results Key pollutants / stressors, sources, current loads

E N D
The Product: Watershed Plan Components Barry Tonning Tetra Tech
Contents of a Watershed Plan • Introduction • Plan area & description, partners, background • Water quality information & analysis • WQ goals, monitoring/assessment results • Key pollutants / stressors, sources, current loads • Proposed management measures • Load reductions needed, BMP types proposed • Reductions expected from BMPs, installation sites • Implementation plan • Public info/education & outreach/involvement plan • BMP/$$/TA support sources, project schedule & costs • Monitoring and adaptive management approach • Interim measurable milestones, load reduction criteria • Evaluation framework, monitoring plan & partners
Introduction • Geographic area • Basis for selection • Watershed inventory • Physical description • Climate • Geology • Hydrology • Soils • Biota • Land cover & uses • Resources & recreation • Programmatic infrastructure • Economic, social, cultural and historic background • Partners
Water quality info & analysis • Water quality goals • Designated uses, WQ criteria • Restoration and protection goals • Flooding, aesthetics, others??? • Monitoring and assessment results • Desktop data mining, local monitoring results • ID impaired & threatened waters • Key pollutants / stressors • Check 303(d); local monitoring/assessment • Pollutant sources • From 303(d) or other assessment • Current loads • Estimate, model, or otherwise quantify
Physical and Natural Features Watershed boundaries Hydrology Topography Soils Climate Habitat Wildlife Land Use and Population Characteristics Land use and land cover Existing management practices Demographics Waterbody Conditions Water quality standards 305(b) report 303(d) list TMDL reports Source Water Protection Areas Pollutant Sources Point sources Nonpoint sources Waterbody Monitoring Data Water quality data Flow data Biological data Types of Data for Watershed Characterization
Who has assessment data? • Federal agencies • USGS, USFWS, USFS, BLM, USACE • State agencies • Water, fish & game, forest, ag • Colleges & universities • Special studies, class projects • Watershed groups • Volunteer monitoring programs, local knowledge • Local agencies • Water/wastewater, health, planning and zoning, etc.
Flow data is available from the US Geological Survey web site at http://waterdata.usgs.gov/nwis/rt
Source Water Protection Map for Slate Creek (Montgomery County)
Waterbodies Requiring TMDLs Within theLower Grand River Watershed
Sample Data Sources • Watershed Coverages: • 8-digit: http://water.usgs.gov/GIS/huc.html • 14-digit:www.ncgc.nrcs.usda.gov/products/datasets/watershed • EPA Reach Files - 3 versions RF1, RF2, RF3-Alpha (most detailed) • www.epa.gov/waterscience/ftp/basins/gis_data/huc/ • Elevation Data • USGS: http://edc.usgs.gov/geodata • GIS data depot: http://data.geocomm.com • Land Use/Population • USGS: http://edc.usgs.gov/geodata • EPA: www.epa.gov/nrlc/nlcd.html • BLM Management Plans • www.blm.gov/planning/plans.html
Other Data Sources • State 303 (d) lists and TMDL reports • www.epa.gov/owow/tmdl • Point source discharge permits • www.epa.gov/enviro/html/pcs/index.html • Agricultural Statistics • http://www.nass.usda.gov/ index.asp • Septic tank use • http://quickfacts.census.gov/
Unified Subwatershed and Site Reconnaissance Survey Neighborhood Source AssessmentHot Spot InvestigationPervious Area AssessmentStreets and Storm Drain Assessment
Identifying stressors and sources • Identify specific causes & sources of water quality impairments or threats • Examples: metals / acidity from X number of abandoned mine lands, sediment & high flows from urban runoff, sediment from construction sites, habitat loss from channelization, etc. • Quantify or estimate pollutant sources requiring controls • Examples: # of miles of pasture streams needing fencing; number of mine sites needing treatment with estimates and general profiles of flows, etc. • Can “bundle” stressors and/or sources • All pasture cattle operations, all development sites • All sources of sediment, all sources of phosphorus
Supplementing available data • Windshield surveys • Interviews with residents • Volunteer monitoring • Bioassessment • Targeted sampling • Chemical/biological sampling Helps lay the groundwork for implementation!
Existing loads come from: • Point-source discharges (NPDES facilities) • Info is available on the discharges (DMRs, etc.) • Some are steady-flow, others are precip-driven • Nonpoint sources (polluted runoff) • All are (mostly) precip-driven • Calculating the “wash-off, runoff” load is tough • Literature values can be used to estimate • Modeling gets you closer . . . . do you need it? • Air / atmospheric deposition • Can be significant in some locations
Steady-load: sewage treatment plant discharge via infrared photography
Nonpoint source: precip-driven (this may be a point source in some cases!)
What is a “load?” • Maybe measured by weight . . . • Kilograms per day • Pounds per week • Tons per month • Maybe not . . . • Concentration-based expression of the “load” (e.g., milligrams per liter) • mg/L x L/day = mg/day [C = m/v] • # of miles of streambank needing stabilization or vegetation • # of AFOs requiring nutrient plans • % of urban area to be ‘perforated’
Identification of causes & sources • What “pollutants” are you dealing with? • Chemical or other stressors or causes of impairment • How big is the problem for each? • How do you know? • Did you “measure” them? • Did you estimate? How? • Where are they coming from? • Can you put the info on a map? • Can you estimate the % from each source?
Reducing loads: the basics • Simple (linear) approach • Use observed data • Empirical relationships • Reduce the concentration • Reduce the source area • Reduce # of sources • Complex (modeled) approach • Model the loadings • Model BMP reductions • Layers can include topography, soils, climate, land use, land cover, pollutant transport/fate, point sources, management practices, etc.
To model, or not to model . . . • As these things increase: • Number of pollutants • Complexity of loads/stressors • Uncertainty regarding existing information • Expense involved in addressing problems • The need for more sophisticated modeling also increases
Watershed analysis is on ongoing learning process – iterative & creative!
Proposed management measures • Load reductions needed • Estimate quantitatively • Metrics selected should make sense! • BMP types proposed • What will lessen your ‘loads’? • Applicable to your situation? • Load reductions from BMPs • How can you measure BMP impacts? • Use literature or actual values • BMP installation sites • Which sites will hit the source(s)? • Are there critical areas to focus on?
Examples of Different Scenarios to Meet the Same Load Target
Select the most appropriate BMPs • Look at what’s worked and what hasn’t • Research effectiveness • Consider costs/benefits • Property ownership/site access • Look for added benefits • Use a combination of techniques • Focus efforts on critical areas; use more or better BMPs there