Download

1 / 46
460 likes | 646 Vues
Economic Update and Five Year Forecast. A presentation to the City Council -- Carol Swindell, Finance Director October 13, 2007. Presentation Outline. Preliminary FY 2006-07 Year End Results Economic Update Five Year Forecast Update Fiscal Policies. Preliminary Year End Results.

E N D
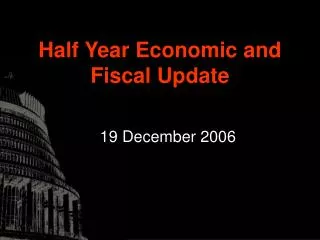
Economic Update andFive Year Forecast A presentation to the City Council -- Carol Swindell, Finance Director October 13, 2007
Presentation Outline • Preliminary FY 2006-07 Year End Results • Economic Update • Five Year Forecast Update • Fiscal Policies
2007-08Revised Revenue Estimates Total Additional $0.3M
Economic Update Preparation for FY2008/09 Budget
Job-growth numbers allay fears of recession Holiday retail: More chill than cheer Stocks Are on the Rise Even as the Economy Loses Steam National Economy Economy uncertain Rising Foreclosures in L.A. — The Canary in the Coal Mine
Unemployment low Current inflation easing Stock market booming Federal deficit sliding Weak GDP growth Housing market slump and subprime fallout Weak dollar Future inflation concern Recession? Trends POSITIVE NEGATIVE
U.S. Economic Growth (2000 – 2009) Source: UCLA Forecast for the Nation and California, September 2007
U.S. Unemployment (2000-2009) Source: UCLA Forecast for the Nation and California, September 2007
U.S. Consumer Price Index (2000-2009) Source: UCLA Forecast for the Nation and California, September 2007
Stock Market Increase Source: www.djindexes.com
National Housing Market Source: National Association of Realtors, September 2007
State Economy • Another year of economic doldrums –unemployment ticking upward, overall job growth of less than 1% • Slower growth in taxable sales and personal income • Housing slump and subprime fallout • Budget deficit Many of same issues as national economy
CA Taxable Sales/Personal Income Growth Source: UCLA Forecast for the Nation and California, September 2007
Local Economy Positive and Negative
Unemployment is Consistently Low • City unemployment rates have historically remained well below the County of Los Angeles and the State of California Comparative Unemployment Rates Source: State of California Employment Development Department.
Expanding Job Center • Attractive location for employers • City continues to add jobs, growing by approximately 2,000 since 2004 Source: State of California Employment Development Department.
High Demand for Office Space • Office vacancy rate is below the 9.5% average for the Los Angeles market area • Asking rents far exceed rents in other areas Source: Grubb & Ellis Research. * As of 2Q07.
CSM Building Permits/Valuation Source: City of Santa Monica Building and Safety Division
% Growth from year prior 1.3% 1.6% 7.0% 11.1% 8.4% 9.8% 8.2% 7.6% 5.3% 9.4% 8.8% 7.1% Property Tax Revenue Growth Based on Strong AV Growth Source: Los Angeles County Auditor-Controller.
Property Tax: How much goes to Santa Monica? City (Non-RDA) 14 ¢ College/Other 8 ¢ County 39 ¢ Schools 39 ¢ Source: HdL
Property Transfers Source:County of Los Angeles Registrar Recorder
Diversified Tax Base Source: City of Santa Monica FY2007-08 Adopted Budget
Status of Key Revenues – Sales Tax * Adjustments associated with implementation of Triple Flip resulted in lower reported sales tax revenues in FY2004-05. Sources: 2003-2006 Taxable Sales data from California State Board of Equalization. 2007 Taxable Sales, Sales Tax data from City.
$32,663 $13,286 Strong Retail Sales Per Capita FY 2006-07 (Per Capita)
Santa Monica TourismLodging Rental/Occupancy Rates Source: PKF Consulting
Average Room Rates-Various Cities Source: PKF Consulting
Gross Receipts-Santa Monica Businesses Billions Source: City of Santa Monica Finance Department
Utility Users Tax • Legal challenges may reduce or eliminate telecommunication portion of UUT • Loss from telecommunication services could result in lower ongoing revenues of $8-12 million per year
Economic Summary • Slower economic growth expected • Small chance of a recession • Housing weakness expected to continue through 2009 • Interest rates could drop further • Tightening credit may impact local economy
Fund Forecasting General Fund
Forecast Assumptions Revenues: • Reflects FY06/07 unaudited results • Adjusted FY07/08 revenues to reflect changes in projected ongoing revenues • Utility User Tax annual growth at 1.8% adjusted for ongoing revenue losses of $4.8 m. (FY08/09), $7.0 m. (FY09/10 and beyond) • Sales Tax average annual growth 5.5% adjusted for Santa Monica Place redevelopment (Total $1.2 m. over 18 months)
Forecast Assumptions Revenues: • Property Tax average annual growth 4.1% • Business License Tax annual growth 4.5% • Transient Occupancy Tax growth range from 5.5% (FY07/08) to 3% (FY11/12)
Forecast Assumptions Expenditures: • Labor costs inflated by MOU upper limit: CPI plus 0.5% • Supply & Expenses increase by CPI • Capital programs limited to $10 million in one-time projects
Forecast Assumptions Expenditures: • MOU changes incorporated • Program growth limited to current programs plus 415 PCH and operation of the PDC/Permit Center • Includes subsidies for the Civic Auditorium, Beach, Cemetery and Pier funds
General Fund Expenditures • Driven by labor costs
$10.7M Projected Shortfall Budget Gaps
Expanded Fiscal Policies Policies are key to ensuring the City’s long-term fiscal health Local economy is important But not the most critical feature…. financial management counts!! Not just for the “good times” --- may be more important in the “bad times”
Fiscal PoliciesExamples of Areas to Cover • General • Maintain sound financial practices • Assure long-term fiscal viability • Operating Budget • Ongoing revenue sufficient to cover ongoing expenditures • Periodic budget review • Revenue • Maintain diversified and stable revenue base • Expenditures • Debt • Target ratios • Use of pay as you go vs. when to issue debt • Reserves • Minimum target of 20-25% in total • Consider targeted reserve for economic uncertainties
Fiscal PoliciesExamples of Areas to Cover • Capital Improvements • 10-year plan • 5-year CIP • Future operating cost impact • Accounting, Auditing and Financial Reporting • Investments • Annual policy review
Budget Milestones • Community Outreach – November 2007 • Mid-Year Update – January 2008 • Council Priorities – January 2008 • Budget Development – Jan - April 2008 • Budget Study Sessions – May 2008 • Budget Adoption – June 2008