Download
1 / 1
10 likes | 132 Vues
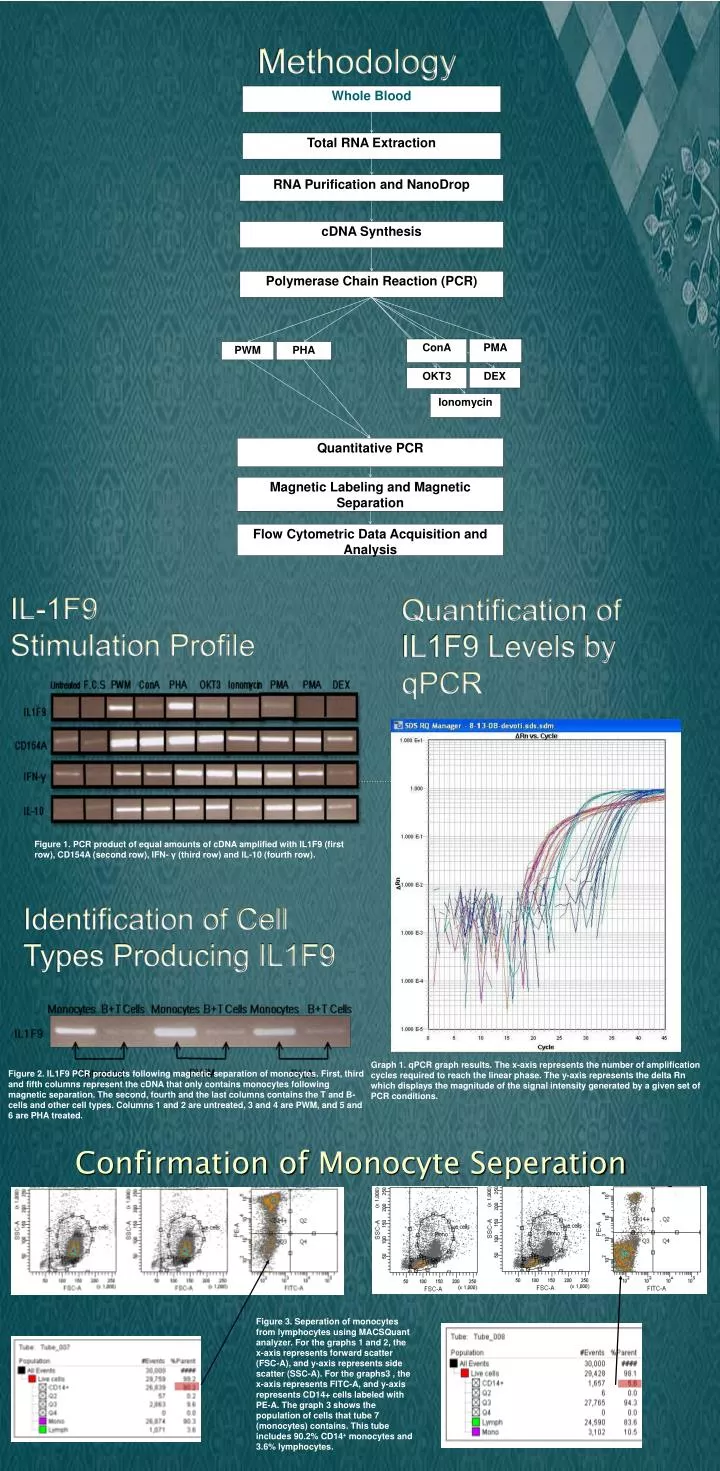
Methodology. Whole Blood. Total RNA Extraction. RNA Purification and NanoDrop. cDNA Synthesis. Polymerase Chain Reaction (PCR). ConA. PMA. PWM. PHA. OKT3. DEX. Ionomycin. Quantitative PCR. Magnetic Labeling and Magnetic Separation. Flow Cytometric Data Acquisition and Analysis.

E N D
Methodology Whole Blood Total RNA Extraction RNA Purification and NanoDrop cDNA Synthesis Polymerase Chain Reaction (PCR) ConA PMA PWM PHA OKT3 DEX Ionomycin Quantitative PCR Magnetic Labeling and Magnetic Separation Flow Cytometric Data Acquisition and Analysis IL-1F9 Stimulation Profile Quantification of IL1F9 Levels by qPCR Figure 1. PCR product of equal amounts of cDNA amplified with IL1F9 (first row), CD154A (second row), IFN- γ (third row) and IL-10 (fourth row). Identification of Cell Types Producing IL1F9 Graph 1. qPCR graph results. The x-axis represents the number of amplification cycles required to reach the linear phase. The y-axis represents the delta Rn which displays the magnitude of the signal intensity generated by a given set of PCR conditions. Figure 2. IL1F9 PCR products following magnetic separation of monocytes. First, third and fifth columns represent the cDNA that only contains monocytes following magnetic separation. The second, fourth and the last columns contains the T and B-cells and other cell types. Columns 1 and 2 are untreated, 3 and 4 are PWM, and 5 and 6 are PHA treated. Confirmation of MonocyteSeperation Figure 3. Seperation of monocytes from lymphocytes using MACSQuant analyzer. For the graphs 1 and 2, the x-axis represents forward scatter (FSC-A), and y-axis represents side scatter (SSC-A). For the graphs3 , the x-axis represents FITC-A, and y-axis represents CD14+ cells labeled with PE-A. The graph 3 shows the population of cells that tube 7 (monocytes) contains. This tube includes 90.2% CD14+ monocytes and 3.6% lymphocytes.