Download
1 / 28
290 likes | 435 Vues
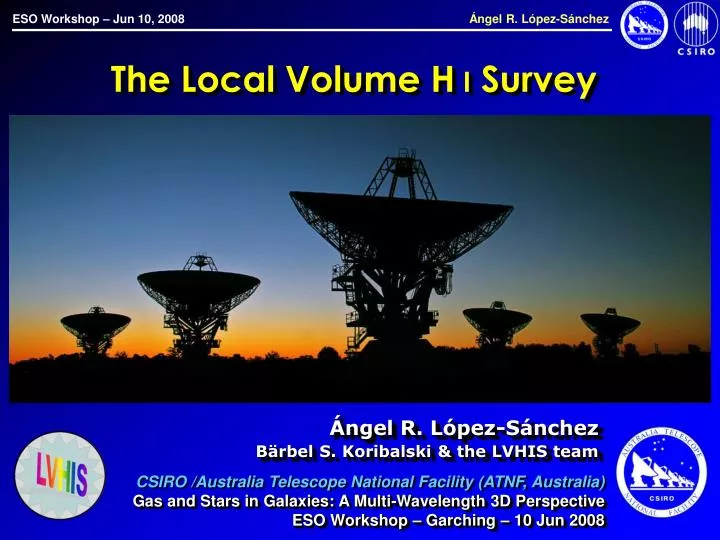
The Local Volume HI Survey. The Local Volume H I Survey. Ángel R. López-Sánchez Bärbel S. Koribalski & the LVHIS team. CSIRO /Australia Telescope National Facility (ATNF, Australia) Gas and Stars in Galaxies: A Multi-Wavelength 3D Perspective ESO Workshop – Garching – 10 Jun 2008.

E N D
The Local Volume HI Survey The Local Volume H I Survey Ángel R. López-Sánchez Bärbel S. Koribalski & the LVHIS team CSIRO /Australia Telescope National Facility (ATNF, Australia) Gas and Stars in Galaxies: A Multi-Wavelength 3D Perspective ESO Workshop – Garching – 10 Jun 2008
M81 and IC342groupings M83 and CenAgroupings Sculptorgroup Galaxies in the Local Volume • Local Volume: 10 Mpc(vLG< 550 km/s) ~ +500 galaxies • Region in which accurate distances are obtained. • It permitsmultiwavelengths analysis, in particular H I surveys. From Karachentsev et al. 2004 (based on 450 LV galaxies with D < 10 Mpc)
Galaxies in the Local Volume HIPASS: H I Parkes All Sky Survey • Local Volume: 10 Mpc(vLG< 550 km/s) ~ +500 galaxies • Region in which accurate distances are obtained. • It permitsmultiwavelengths analysis, in particular H I surveys. LVHIS: +70 galaxies from the ATCA HIPASS LVHIS From Karachentsev et al. 2004 (based on 450 LV galaxies with D < 10 Mpc)
LVHIS observations • Deep H I line & 20 cm radio continuum observations for all nearby (vLG< 550 km/s, D < 10 Mpc) gas-rich galaxies (HIPASS) with δ < -30º • Full12h x 3 ATCA arrays (EW367, 750m, 1.5km) • Angular resolution of 40” – 200” (1 – 5 kpc at D = 5 Mpc) • Velocity resolution of 4 km/s • HI column density 5 x 1019 cm-2(for 60” beam) • Expand to GMRT, VLA, WSRT COMPLETE NOW! LVHIS teamBärbel Koribalski (ATNF, PI)Ángel R. Lopez-Sanchez (ATNF)Lister Staveley-Smith (UWA)Jürgen Ott (NRAO)Erwin de Blok (U. Capetown)Helmut Jerjen (ANU)Igor Karachentsev (SAO, Russia)Janine van Eymeren (U. Bochum / ATNF) Emma Kirby (ANU / ATNF)Nic Bonne (ANU / ATNF) http://www.atnf.csiro.au/research/LVHIS
ESO 154–G023 NGC 1313 + AM0319–662 ESO 215–G009 NGC 253 NGC 5253 20cm cont + R image IC 5052 H I map (blue) + H (green) + H (red) (Kirby et al. 2008) NGC 7793 NGC 5253 LVHIS objectives • Deep H I imaging of all nearby, gas-rich galaxies • IntegratedHI distribution • galaxy diameters, • asymmetries, • tidal tails, • companions • Mean HI velocity field • Vrot (r), incl (r), PA (r) • Mean HI velocity dispersion • multiple components, • line broadening • Deep 20-cm radio continuum imaging • Star formation rates • Globally and locally • Deep H-band and Hα imaging, and multiwavelength comparison (UV, Opt, NIR, FIR)
LVHIS Science • HI and total mass distribution in the Local Volume • HI mass function & optical luminosity function • HI vs optical diameter • MHI/LB , MHI/LH ratios • Detailed rotation curves Dark Matter distribution • (Baryonic) Tully-Fisher relation • Local galaxy environments (tidal features, etc.) • Galaxy spin vector alignments • Star formation rates • The local Hubble flow and dispersion • …
Visible(8.2m VLT) UGCA 365 M 83 (NGC 5236) • Late type spiral galaxy in the Cen A Group. • Type: • SAB(s)c, • H II starburst; • Optical diameter • 12.9' x 11.5', • Dcepheid • 4.5 ± 0.3 Mpc. • H I mapATCA mosaic, Koribalski et al, in p. • MHI = 8 109 M • HI extend > 80 kpc • Streamers, • Asymmetric tidal arm, • Diffuse emission, • H I distribution is ENORMOUS, several times larger than its stellar disk • H I velocity field: • Thoroughly twisted velocity field • Mildly interacting with the neighbouring dwarf galaxies • It seems to be a distorted one-armed spiral, suggesting that it may have interacted or merged with another, smaller galaxy.
5º The M 83 subgroup Koribalski 2006 Koribalski et al. In preparation
8.8’ The galaxy NGC 5253 • DHel= 4.0 Mpc (Karachentsev et al. 2004) • Scale: 19 pc / arcsec • Optical size: 5.0’ 1.9’ • Classified as Im pec, H II starburst (NED), BCDG • One of the closest starbursts, observed at all wavelengths • It belongs to the M83 subgroup of the Centaurus Group • Deep analysis of its ionized gas using VLT López-Sánchez et al. 2007 NGC 5253 – B (blue) + V (green) + I (red) 2.5m du Pont telescope, Las Campanas Observatory, combined by Á.R. López-Sánchez NGC 5253 – V (blue) + I (green) + H (red) 2.5m du Pont telescope, LCO (V, I) + 1.5m CTIO (H) combined by Á.R. López-Sánchez
Kobulnicky & Skillman, 1995 NGC 5253: H I radio data New radio data of NGC 5253 from the LVHIS project using three different ATCA arrays: • 1.5A, 2x750A, EW367, no CA6. • 6 km/s resolution, 32 channels • Beam size: 86” 47”, PA 5º • rms ~ 1.9 mJy /beam NGC 5253 VLA H I total intensity (contours) and optical image (gray image), Kobulnicky & Skillman, 1995, ApJ, 454, L121 NGC 5253 ATCA H I total intensity (false color) and DSS R optical image (contours)
NGC 5253: H I radio data Total H I flux: • ATCA: 31.1 1.5 Jy km/s • VLA: 33.4 9.9 Jy km/s (Paturel et al. 2003) • H I mass: (8.0 0.4) 107 M • Dynamical mass: ~108 M NGC 5253 – H I map (blue) + R (green) + H (red)
NGC 5253: H I radio data Rotation? H I velocity field: Rotating about the optical MAJOR axis? Optical major axis NGC 5253 ATCA H I velocity field
NGC 5253: H I radio data ESO 154-G023 ATCA H I velocity field H I velocity field: Rotating about the optical MAJOR axis? • Any kind of outflow? • Formation of a polar ring? • Interaction with M83 ~1 Gyr ago? • Disruption/accretion of a gas-rich companion? See “Interactions and star formation activity in Wolf-Rayet galaxies” López-Sánchez PhD Thesis and Kobulnicky & Skillman 2008 H I velocity field: Rotating about the optical MAJOR axis?
Dwarf galaxies Comparison of H I and H properties van Eymeren et al. 2008, in prep. • NGC 5408 • D = 4.81 Mpc, IB(s)M • Opt. size = 2.6’ x 1.6’ • H I size= 10’ x 6.3’ • H I maxima coincide with H II regions • H I mass: 3.2 108 M • Fairly regular H I velocity field • IC 4662 • D = 2.44 Mpc, BCDG • Opt. size = 3.0’ x 1.6’ • H I size= 15’ x 12’ • H I mass: 1.6 108 M • Very distorted H I velocity field and intringuing H kinematics • Gaussian decomposition of the H I and H line shows outflows in both galaxies, with expansion velocities up to 75 km/s. NGC 5408 IC 4662
Dwarf galaxies Comparison of H I and H properties van Eymeren et al. 2008, in prep. • NGC 5408 • D = 4.81 Mpc, IB(s)M • Opt. size = 2.6’ x 1.6’ • H I size= 10’ x 6.3’ • H I maxima coincide with H II regions • H I mass: 3.2 108 M • Fairly regular H I velocity field • IC 4662 • D = 2.44 Mpc, BCDG • Opt. size = 3.0’ x 1.6’ • H I size= 15’ x 12’ • H I mass: 1.6 108 M • Very distorted H I velocity field and intringuing H kinematics • Gaussian decomposition of the H I and H line shows outflows in both galaxies, with expansion velocities up to 75 km/s. NGC 5408 IC 4662
Central ring (16”x 12”) of NGC 1512 (HST, Maoz et al. 2001) The galaxy pair NGC 1512 / 1510 • NGC 1512: • SB(r)ab, Z ~0.7 Zo • D = 9.5 Mpc • Bar ~ 3’ = 8.3 kpc • Ring ~ 3’ x 2’ = 8.3 x 5.5 kpc • Nuclear ring ~ 16” x 12” (740 x 550 pc) • NGC 1512: • SB(r)ab, Z ~0.7 Zo • D = 9.5 Mpc • Bar ~ 3’ = 8.3 kpc • Ring ~ 3’ x 2’ = 8.3 x 5.5 kpc • Nuclear ring ~ 16” x 12” (740 x 550 pc) • NGC 1510: • S0, BCD, WR, Z~0.2 Zo • 5’ = 13.8 kpc from NGC 1512 • H images (Meurer et al. 2006) reveal many star forming regions • Sizes 2” – 5” (90 – 230 pc) • Dozens in the ring • NGC 1510 • But also in external regions with no evident continuum emission!
Deep UV image (FUV + NUV, GALEX, Gil de Paz et al. 2007) NGC 1512/1510 deep optical / UV images Deep optical image (1.2 UKST, David Malin, priv. com.)
NGC 1512 / 1510 – ATCA H I low resolution map • Between 1996 and 2005 • 7 arrays • Mosaic using 4 pointings • Total time: 4477 min(3.11 days) • Several H I maps: • Low resolution, na-w, no CA06, b = 88.3” x 75.5” • Medium resolution, ro-w, no CA06, b = 62.1” x 55.3” • High resolution, ro-w, b = 13.0” x 11.3” • Several radio -continuum maps F HI = 268 Jy km/s M HI = 5.7 x 10⁹ Mo MHI / LB ~ 1 Koribalski, López-Sánchez & McIntyre, 2008, submitted
H I / UV comparison in NGC 1512/1510 Using GALEX images, we have derived UV colors and SFRs in individual UV-rich clusters and compare with HI distribution • SFR / Area increases with increasing M HI / Area • FUV – NUV color decreases with increasing M HI / Area Places with higher HI column density have higherstar formation activity and show younger ages
NGC 1512 / 1510 Rotation fit and residues • The velocity field is mainly rotation, • But we found some discrepances in the most external regions and in the position of NGC 1510. • Star formation activity and the external HI structures seem to be consequence of the interaction that NGC 1512 and NGC 1510 are experiencing. • Further analysis (i.e., including numerical simulations) will quantify the importance of such interaction. Koribalski, López-Sánchez & McIntyre, 2008, subm. NGC 1512 / 1510 also include in the THING project, with higher spatial resolution (Deane & de Blok, in prep)
Conclusions • LVHIS (Local Volume H I Survey) project is obtaining deep H I and 20 cm radio-continuum imaging and of all nearby, gas-rich galaxies of the Local Volume (10 Mpc), so far +70 using the ATCA. • In order to understand: • H I distribution and environment, • Kinematicsanddynamics, • Barionic and non-barionic matter distribution, • Star formation properties on all scales. • Multiwavength comparison • Stellar distribution using deep H-band images • Ionized gas distribution using H • UV (GALEX) and IR (SPITZER) data when available • It is essential to know the properties of local galaxies in order to understand and to link with the properties of galaxies at higher redshifts (surveys at SKA & pathfinders). http://www.atnf.csiro.au/research/LVHIS


![Real-Time Volume Graphics [06] Local Volume Illumination](https://cdn2.slideserve.com/4770316/real-time-volume-graphics-06-local-volume-illumination-dt.jpg)