Download
1 / 30
360 likes | 688 Vues
Hypertriglyceridemia, Insulin Resistance Syndrome, and CHD Risk. Hypertriglyceridemia. Evidence for a role in the development of CHD fasting serum TG concentration as independent risk factor in epidemiologic studies direct role of TG-rich lipoproteins in atherogenesis

E N D
Hypertriglyceridemia,Insulin Resistance Syndrome,and CHD Risk
Hypertriglyceridemia • Evidence for a role in the development of CHD • fasting serum TG concentration as independent risk factor in epidemiologic studies • direct role of TG-rich lipoproteins in atherogenesis • association with other abnormalities of lipid and carbohydrate metabolism • association with hypercoagulability
Hypertriglyceridemia—An Independent Risk Factor for CHD: PROCAM Study 150 132 93 100 81 Events/ 1,000 in 8 yr 44 50 0 <200(157/3,593) 200-399(84/903) 400-799(14/106) 800(3/37) TG (mg/dL) Assmann G et al. Am J Cardiol. 1992;70:733-737.
Fasting TG and Risk for CHD Death: Paris Prospective Study TG 123 mg/dL TG 123 mg/dL 6 4 Mean annual CHD mortality rate/1,000 2 0 220 >220 220 >220 Cholesterol (mg/dL) Adapted from Fontbonne A et al. Diabetologia. 1989;32:300-304.
Fasting TG and Risk for CHD: Helsinki Heart Study 35 LDL-C:HDL-C 5.0 LDL-C:HDL-C >5.0 30 25 Gemfibrozil 20 Placebo Incidence of cardiac events/ 1,000 person yr 15 10 5 0 200 >200 200 >200 TG (mg/dL) Adapted from Manninen V et al. Circulation. 1992;85:37-46.
Impact of TG Levels on Relative Risk of CHD: Framingham Heart Study 3.0 Men Women 2.5 2.0 RR 1.5 1.0 0.5 0.0 50 100 150 200 250 300 350 400 TG (mg/dL) Castelli WP. Can J Cardiol. 1988;4:5A-10A.
A Nested Case Control Analysis of Coronary Risk Factors in Men With* and Without† MI Risk factor Case subject Control P value Age, yr 58.6 58.7 Matching factor Body mass index, kg/m2 25.5 25.0 0.05 Alcohol consumption, drinks/day 0.45 0.53 0.03 TC, mg/dL (mmol/L) 229 (5.92) 211 (5.46) <0.001 HDL-C, mg/dL (mmol/L) 47 (1.22) 49 (1.27) 0.03 TC:HDL-C ratio 5.2 4.6 <0.001 TG, mg/dL (mmol/L) 203 (2.29) 155 (1.75) 0.001 Median TG level, mg/dL (mmol/L) 168 (1.90) 132 (1.49) * 266 MI cases. † 308 controls. Stampfer MJ et al. JAMA. 1996;276:882-888.
A Nested Case Control Analysis of Coronary Risk Factors in Men With* and Without† MI (cont.) Risk factor Case subject Control P value LDL diameter, nm 25.6 25.9 <0.001 LDL phenotype, %A 33 43 0.002Intermediate 20 24 B 47 33 History of angina, % 4 2 0.07diabetes, % 6 4 0.23hypertension, % 27 18 0.01 Family history of MI, % 18 11 0.02 * 266 MI cases. † 308 controls. Stampfer MJ et al. JAMA. 1996;276:882-888.
Future Risk for Myocardial Infarction Adjusted for age and smoking RR 95% CI P value LDL diameter, 0.8 nm 1.38 1.18-1.62 <0.001 TG, 100 mg/dL (1.13 mmol/L) 1.43 1.22-1.68 <0.001 HDL-C, 10 mg/dL (0.26 mmol/L) 0.87 0.76-0.98 0.03 TC, 40 mg/dL (1.03 mmol/L) 1.65 1.37-1.99 <0.001 TC:HDL-C ratio 1.35 1.19-1.53 <0.001 Stampfer MJ et al. JAMA. 1996;276:882-888.
400 300 Uncorrected Corrected for fasting TG level* 300 200 Cases TG(mg/dL) 200 Controls SEM 100 100 0 0 0 2 4 6 8 0 2 4 6 8 Hours after test meal Hours after test meal TG Metabolism in CHD: Studies in the Postprandial State Line plots of postprandial TG kinetics in coronary artery disease patients and control subjects.* TG levels in the course of postprandial lipemia in cases and control subjects. Patsch JR et al. Arterioscler Thromb. 1992;12:1336-1345.
Hypertriglyceridemia and Risk for CHD • TG elevation is generally associated with increased risk for CHD on univariate analysis • Is the relation causal? • Or is the TG elevation simply a marker for CHD risk through its associations with such conditions as type 2 diabetes mellitus, low HDL-C, and obesity? • The TG-CHD relation tends to weaken or disappear on multivariate analysis
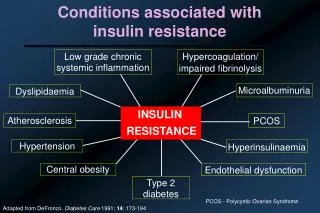
Hypertriglyceridemia and CHD Risk: Associated Abnormalities • Accumulation of chylomicron remnants • Accumulation of VLDL remnants • Generation of small, dense LDL-C • Association with low HDL-C • Increased coagulability • plasminogen activator inhibitor (PAI-1) • factor VIIc • activation of prothrombin to thrombin
Association of Small, Dense LDL With Myocardial Infarction N (%) LDL pattern Cases Controls A 54 (37) 90 (63) B 55 (64) 31 (36) Odds ratio=3.0; P<0.01. 95% CI=1.7-5.2. Adapted from Austin M et al. JAMA. 1988;260:1917-1921.
CHD Mortality and Hyperinsulinemia:Paris Prospective Study (n=943) 3 P<0.01 2 CHD mortality (per 1,000) 1 0 29 30-50 51-72 73-114 115 Quintiles (pmol) of fasting plasma insulin Fontbonne AM et al. Diabetes Care. 1991;14:461-469.
Prevalence of Macrovascular Disease and CHD According to Quintiles of Fasting C-Peptide Nondiabetic controls(n=178) Noninsulin-treatedtype 2 diabetics (n=154) 60 80 P <0.001 P <0.05 70 50 60 40 50 % Macrovasculardisease % Macrovasculardisease 30 40 30 20 20 10 10 0 0 1 2 3 4 5 1 2 3 4 5 80 60 P <0.002 70 50 60 40 50 40 30 % CHD % CHD 30 20 20 10 10 0 0 1 2 3 4 5 1 2 3 4 5 Fasting C-peptide quintiles (1-5) Janka HU. Horm Metab Res. 1985;15(suppl):15-19.
Responses to a 75-g Oral Glucose Challenge in Relation to LDL Particle Diameter 10 1000 Plasma glucose Insulin 8 800 6 600 Glucose(mmol/L) Insulin(pmol/L) 4 400 LDL diameter averagePattern A: 268±4 (n=52)Intermediate: 261±3 (n=29)Pattern B: 250±4(n=19) 2 200 0 0 30 60 120 180 30 60 120 180 Time (min) Time (min) Reaven GM et al. J Clin Invest. 1993;92:141-146.
Association of Small, Dense LDL With Insulin Resistance Steady-state plasma glucose n=19 12 n=17 10 8 n=19 Glucose (mmol/L) 6 4 2 0 Intermediate pattern A B Adapted from Reaven GM et al. J Clin Invest. 1993;92:141-146.
Characteristics of LDL Phenotype B • Common heritable trait • frequency: 25%–30% of population • Autosomal dominant inheritance • Reduced penetrance in males 20 yr and in premenopausal females • Associated with • increased TG, VLDL, and IDL and reduced HDL2 • threefold increase in MI risk
Cumulative Distribution of Adjusted Plasma TG Levels: LDL Phenotypes A and B 100 90 80 70 60 % Cumulativefrequency 50 40 Phenotype A Phenotype B 30 20 10 0 20 40 60 80 100 120 140 160 180 200 220 240 260 280 300 500 TG (mg/dL) Austin M et al. Circulation. 1990;82:495-506.
Cumulative Distribution of Adjusted HDL-C: LDL Phenotypes A and B 100 90 80 70 60 % Cumulativefrequency 50 Phenotype A 40 Phenotype B 30 20 20 25 30 35 40 45 50 55 60 65 70 75 80 HDL-C (mg/dL) Austin M et al. Circulation. 1990;82:495-506.
Quebec Cardiovascular Study: Baseline Characteristics* Controls Case patients % Characteristic (n=105) (n=91) Difference P value Age (yr) 58.9±6.9 59.2±7.7 - - Body mass index 26.5±3.8 26.2±3.8 - - Systolic blood pressure(mm Hg) 133±18 136±16 - 0.3 *Plus-minus values are means ±SD. The variables used in matching case patients and controls were age, body mass index, smoking status, and alcohol consumption. Case patients as compared with controls. Després JP et al. N Engl J Med. 1996;334:952-957.
Quebec Cardiovascular Study: Baseline Characteristics* (cont.) Controls Case patients % Characteristic (n=105) (n=91) Difference P value TC (mg/dL) 213±35 235±43 11 <0.001 TG (mg/dL) 154±59 179±19 17 0.006 HDL-C (mg/dL) 46±10 37±9 -6 0.07 Apolipoprotein B (mg/dL) 113±27 132±33 17 <0.001 TC:HDL-C ratio 5.7±1.6 6.7±2.0 18 <0.001 Fasting insulin (pmol/L) 78.2±28.8 92.1±27.5 18 <0.001 *Plus-minus values are means ±SD. The variables used in matching case patients and controls were age, body mass index, smoking status, and alcohol consumption. Case patients as compared with controls. Després JP et al. N Engl J Med. 1996;334:952-957.
Relation Between Baseline Fasting Insulin and Ischemic Heart Disease* Coronary event Coronary eventVariable predictors Variable predictors Insulin 0.31 Odds ratio 1.7† 95% CI 0.3-2.4 LDL-C 0.35 Odds ratio 1.9† 95% CI 1.3-2.7 TG 0.17 Odds ratio 1.4‡ 95% CI 1.0-1.9 HDL-C -0.07 Odds ratio 0.88 95% CI 0.65-1.2 Apolipoprotein B 0.37 Odds ratio 1.9† 95% CI 1.4-2.8 TC:HDL-C 0.26 Odds ratio 1.6§ 95% CI 1.2-2.2 * Before and after adjustment for plasma lipid and apolipoprotein B levels in a multivariate logistic analysis. †P<0.001; ‡P=0.05; §P=0.004. =standardized estimate; CI=confidence interval. Odds ratio=increase in risk of HD for every 1 SD in the variable in question. Després JP et al. N Engl J Med. 1996;334:952-957.
NCEP ATP-II Cutpoints for TG and HDL-C mg/dL Normal TG <200 Borderline-high TG 200-400 High TG 400-1,000 Very high TG >1,000 Low HDL-C <35 High (protective) HDL-C 60 Triglycerides, High Density Lipoprotein, and Coronary Heart Disease. NIH Consensus Development Conference Statement. 1992.Expert Panel on Detection, Evaluation and Treatment of High Blood Cholesterol in Adults. JAMA. 1993;289:3015-3023.
Frequent Causes of Secondary Hypertriglyceridemia • Diabetes mellitus • Nephrotic syndrome • Chronic renal failure • Estrogen replacement therapy • Excessive alcohol intake • Medications
Hypertriglyceridemia TreatmentStrategies: Diet Therapy Nutrient NCEP Step 1 Total fat 30% Saturated fat 8-10% Monounsaturated fat 15% Polyunsaturated fat 10% Carbohydrate 55% Protein ~15% Cholesterol <300 mg/d Fiber 10 g/1000 kcal/d
Hypertriglyceridemia Treatment Strategies: If TG <400 Focus on LDL-C • Choose LDL-C goal based on risk factors: majority of patients have two or more other risk factors • Diet, weight loss, exercise • Drug therapy: nicotinic acid, gemfibrozil, newer statins • After LDL-C goal achieved, assess TG level: goal of <200 mg/dL; additional therapies may be needed
Hypertriglyceridemia Treatment Strategies:If TG >400 Focus on TG • TG >400 mg/dL • diet, weight loss, exercise • drug therapy: nicotinic acid, fibrates • if diabetic, consider insulin • After TG <400 mg/dL, assess LDL-C and determine role based on risk factors • If TG <400 mg/dL and LDL-C <130 mg/dL • diet, weight loss, exercise • drug therapy: nicotinic acid, fibrates, statins • After TG <200 mg/dL, assess LDL-C and determine goals based on risk factors
HIT: Favorable Effects of Fibrate on CVD Events in CHD Patients With Isolated Low HDL-C * Nonfatal MI/CHD death CHDdeath All-causemortality TG Stroke LDL-C HDL-C Subjects: 2,531 men Age: £74 (avg 64) yr Mean baseline LDL-C: 111 mg/dL Mean baseline HDL-C: 32 mg/dL Mean baseline TG: 161 mg/dL Duration: 7 yr Intervention: Gemfibrozil 600 mg bid %+ † * ‡ P/Rx 111/115 32/34 161/122 274/219 118/93 88/64 219/197 *P<0.01; †P=0.006; ‡P=0.05P=placebo group; Rx=treated group. Presented by HB Rubins at the 71st annual AHA Scientific Sessions; Dallas, Texas.
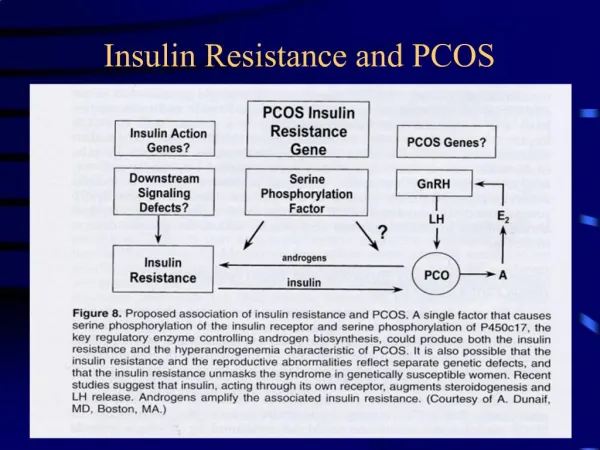
Interrelation Between Atherosclerosis and Insulin Resistance Insulin Resistance Hyper- insulinemia Hypertri- glyceridemia Small, dense LDL Hypercoagu-lability Hypertension Obesity Low HDL Diabetes Atherosclerosis