Download
1 / 38
380 likes | 495 Vues
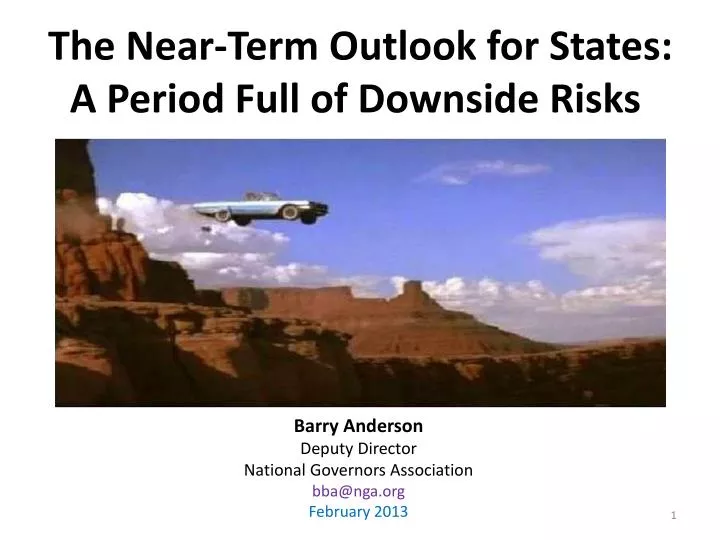
The Near-Term Outlook for States: A Period Full of Downside Risks. Barry Anderson Deputy Director National Governors Association bba@nga.org February 2013. Some Views on Our Fiscal Future. Near Term The next fiscal cliff, and what it means over the next few months. Medium Term

E N D
The Near-Term Outlook for States: A Period Full of Downside Risks Barry Anderson Deputy Director National Governors Association bba@nga.org February 2013
Some Views on Our Fiscal Future • Near Term • The next fiscal cliff, and what it means over the next few months. • Medium Term • Next year, and the years right after that. • Long Term • The major fiscal problem that the US faces is long term fiscal sustainability.
About Me—Experience • 30+ Years in Federal Budgeting • GAO • OMB: Senior Career Civil Servant • CBO: Acting & Deputy Director • FASAB • IMF in Washington • OECD in Paris • Independent Consultant • National Governors Ass’n 3
About Me—Personal • Not an ‘R’ or a ‘D’, but an SOB! • A “Middle of the Roader” 4
The Near Term Fiscal Future: The Next Fiscal Cliff • March 1: Sequester I (the Supercommittee sequester) • A lower nominal rate, but over 7 months instead of 9 • Defense: was 9.4%; now 7.9% • Non-defense: was 8.2%; now 5.3% • March 27: Continuing Resolution • TANF Reauthorization • Sequester II (the BCA sequester) • April 15: House & Senate Budget Resolutions • Needed for Members to get paid • Entitlement & Tax Reform (?) • May 19/Late Summer: Debt Limit
Impact of FY2013 Sequesters*(Budget Authority, in billions of dollars) Source: CBO Budget & Economic Outlook: FYs 2013-2023, February, 2013. *Total appropriations for FY2012 were $1,180B, including $137B of adjustments for Overseas Contingency Operations, disasters, & program integrity. **Includes additional CBO adjustments, mainly $20B in mandatory savings in the CR that were reclassified to mandatory accounts, and a re-estimate of an additional $4B in FHA receipts.
The Major Fiscal Issue Is Long-Term Sustainability: How Do We Cut the Debt & at What Level of Government?
What Level of Government?(% of GDP, CBO Projections as of dates shown)
We Can’t Grow Our Way Out(Percentage change in real GDP; year to year) Sources of projections: for 2012-2023, CBO’s Budget & Economic Outlook: FYs 2013 to 2023, February, 2013; for 2023-2037, CBO’s 2012 Long-Term Budget Outlook, June, 2012.
Debt Projections Before & After the January Fiscal Cliff Deal (Percent of GDP) Source: CBO. The Alternative Fiscal Scenario assumes that the sequester is waived, “doc fixes” are enacted, & expiring tax breaks are extended.
How Much More Do We Need To Do To Stabilize the Debt? • President Obama: $1.5 Trillion • Center for Budget Policy & Priorities: $1.4 Trillion • Columnist Paul Krugman: “a problem that is already, to a large degree, solved.” • Committee for A Responsible Federal Budget: at least $2.2 Trillion
Most of the deficit reductions so far have come from discretionary spending--& the sequester will only add to that(Deficit reduction from FY2013-22, dollars in billions) Sources: CBO; Committee for A Responsible Federal Budget; The Economist. *Includes $75B in tax cuts & $30B in extended unemployment benefits that added to deficits.
Public Debt Projections With and Without Prior Savings* (Percent of GDP) Source: Committee for a Responsible Federal Budget *”Prior Savings” include those enacted in the Budget Control Act of 2011, the American Taxpayers Reduction Act of 2012, and in appropriations since CBO’s August 2010 baseline.
Reasons to Support Reducing the Debt Below 80%/GDP in 2023 • Encourages higher economic growth as the economy moves towards full capacity • Addresses sustainability beyond 10 years, especially given the certainty of higher boomer retirement costs • Provides a margin for error in case of lower-than-forecasted growth or higher interest rates • Provides for fiscal flexibility for unknowns, such as natural disasters or national security threats
Health is by Far Our Biggest Problem!Health Expenditures, 2010(% GDP) Source: OECD Health Data 2012
US National Health Expenditures (% of GDP) Source: Sean Keehan (CMS), et al., “National Health Expenditure Projections”, Health Affairs, 2010-2012
Where Does the Money Go?Higher Prices!(Procedure prices as a % of US prices, 2009) Source: OECD Health at a Glance, 2011
And Higher Spending on Every Category Source: OECD Health at a Glance, 2011
And We “Use” More Health Services Source: OECD Health at a Glance, 2011
Quality of US Health Care is Mixed Source: OECD Health at a Glance, 2011
Factors to Lower Health Care Costs • Eliminate fee-for-service (FFS); replace with systems of care (SoC) • FFS creates incentives for providers to function as revenue centers & promote unneeded services • SoC can create incentives for outcomes & not reward either volume or stinting • Methods can involve partial capitation, episode pricing, shared savings, & high-cost reinsurance • Create larger provider systems • More patients with comprehensive services permits better measurement of performance • Rely on competition to set prices • Administratively-set prices, even if “right”, create lobbying pressures • Reform legal impediments • Malpractice; product liability; corporate practice of medicine • Review administrative costs • Address data availability, prevention, caps, & everything else
How Do We Fix Social Security? First, Its Fundamental Characteristics • Intergenerational • Pay as you go • Obligations defined • Not funded by invested taxes • Zaps higher income earners
Fundamental Characteristics - Restated • Pay as you go • Obligations defined • Not funded by invested taxes • Zaps higher income earners • Intergenerational
Spending on the Elderly1 as a Percentage of GDP 1Social Security + all health. Source CBO Long-Term Budget Outlook, June 2012
Spending on the Elderly1 as a Percentage of GDP 1Social Security + all health. Source CBO Long-Term Budget Outlook, June 2012
SOCIAL SECURITY SOLUTIONS* • Increase Net National Savings • Run surpluses! • Cut benefits • Increase retirement age • Index to prices, not wages • Cut everything else • Increase SS taxes • Convert to private accounts • DB to DC: uncertainty of returns, of longevity, of annuity • Administrative costs: you get what you pay for • Borrow • Swap Treasury debt for equities • Government ownership of means of production *See http://www.esquire.com/blogs/politics/federal-budget-statistics-1110
2013 Marginal Tax Rates for Selected Provisions(Married filing jointly; employee only1. Rate changes bolded.) 1Employers don’t pay the additional .9% Medicare Base or 3.8% Medicare Investment taxes. 2Taxable income for Federal Income; earned income for Social Security & Medicare Base; AGI for Medicare Investment & Pease. 3This rate applies to the lessor of net investment income or the excess of Modified AGI over $250,000. 4Pease reduces itemized deductions (except medical, investment interest, & casualty & theft) by 3% of the amount by which AGI exceeds $300,000, but not more than 80% of the value of itemized deductions. PEP (Personal Exemption Phaseout) is not included; it reduces the $3,900/person exemptions by 2% for the first dollar of each $2,500 increment in exemptions for AGI over $300,000. 5Does not include Earned Income Credit and various other credits for low income filers.
Tax Expenditures: How Do We Limit Them?(2013, in billions of dollars)
Percentage of households paying income or payroll taxes where payroll—including employer’s share— is bigger Source: CBO
Average Social Insurance Tax Rates By Quintiles Source: CBO
Average Tax Rates & Shares by Quintiles, 2009 Source: CBO
Average Incomes & Shares by Quintiles, 2009 ($ in thousands) Source: CBO
Can Another Deal Be Made?Recent Deals and Offers(10-Year Savings; $ in Billions)