1 / 1

Figures S7a and S7b

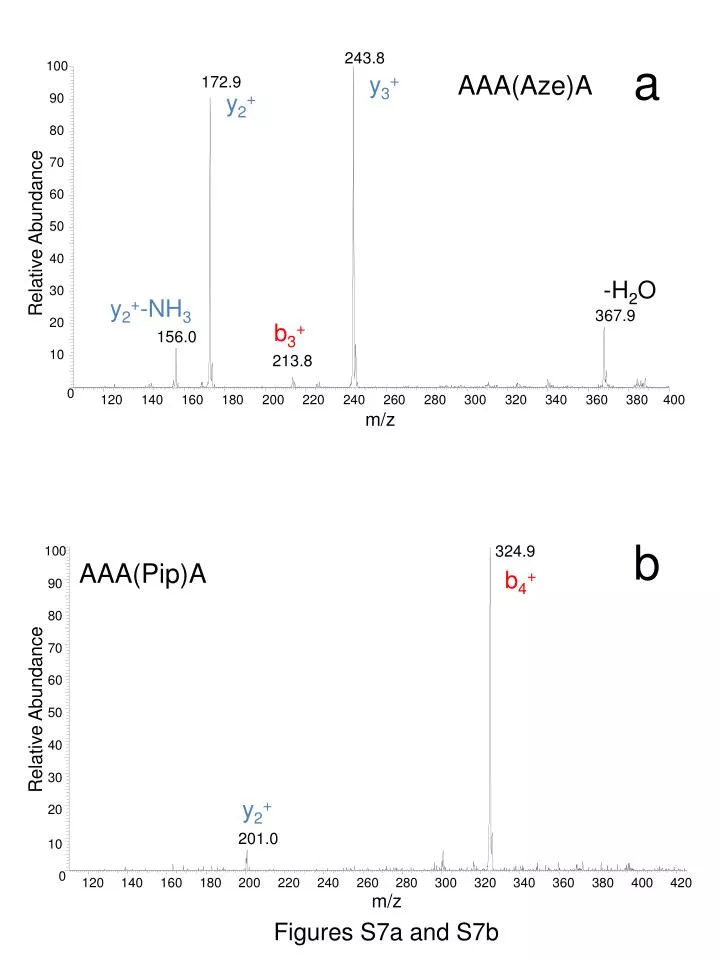
243.8. 100. 172.9. 90. 80. 70. 60. Relative Abundance. 50. 40. 30. 367.9. 20. 156.0. 10. 213.8. 0. 120. 140. 160. 180. 200. 220. 240. 260. 280. 300. 320. 340. 360. 380. 400. m/z. 324.9. 100. 90. 80. 70. 60. Relative Abundance. 50. 40. 30. 20. 201.0. 10.

dylan-gould
Télécharger la présentation

Figures S7a and S7b

An Image/Link below is provided (as is) to download presentation Download Policy: Content on the Website is provided to you AS IS for your information and personal use and may not be sold / licensed / shared on other websites without getting consent from its author. Content is provided to you AS IS for your information and personal use only. Download presentation by click this link. While downloading, if for some reason you are not able to download a presentation, the publisher may have deleted the file from their server. During download, if you can't get a presentation, the file might be deleted by the publisher.

E N D

Presentation Transcript


  1. 243.8 100 172.9 90 80 70 60 Relative Abundance 50 40 30 367.9 20 156.0 10 213.8 0 120 140 160 180 200 220 240 260 280 300 320 340 360 380 400 m/z 324.9 100 90 80 70 60 Relative Abundance 50 40 30 20 201.0 10 0 120 140 160 180 200 220 240 260 280 300 320 340 360 380 400 420 m/z a AAA(Aze)A y3+ y2+ -H2O y2+-NH3 b3+ b4+ b AAA(Pip)A y2+ Figures S7a and S7b

More Related