Download
1 / 23
230 likes | 327 Vues
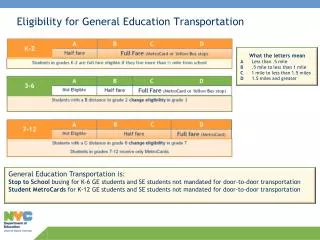
General Education Transportation Services Board of Education February 28, 2012. What’s Changing and Why?. Yellow bus services for general education students attending elementary and middle schools Students with IEPs that require transportation will not be impacted

E N D
General Education Transportation ServicesBoard of EducationFebruary 28, 2012
What’s Changing and Why? • Yellow bus services for general education students attending elementary and middle schools • Students with IEPs that require transportation will not be impacted • Support Board’s policy guidelines • Minimize the use of general fund contributions for transportation
December 2010 – Board Policy • New transportation policy (108-24SP1) • First revision since 1970s (horse shoe plan) • Designed to support strategic plan commitments and new student assignment policy • Development process included discussions at community meetings throughout the city
December 2010 – Board Policy • Support choice in student assignment as a tactic for creating diversity • Provide reasonable access • to English Learner & newcomer pathways • from CTIP1 to K8 and immersion • to attendance area school • Support middle school feeder patterns • Limited services to after school if feasible and necessary to support District’s vision
February 2011 – 3 Year Plan • Three year implementation plan shared (list of schools) • Multilingual FAQ and feedback forms • Feedback reviewed by Transportation Working Group
Explored Charging Fees • Not feasible because • many of our students are low-income • State puts cap on amount districts can charge – if we charged fees, not likely to cover costs • significant administrative costs associated with developing a fee-for-service model
August 2011 – Implemented Year 1 • Eleven schools lost general education transportation services: Chavez, Garfield, Grattan, key, Marshall, Miraloma, Parker, Peabody, Sunset, Sutro, and Yick Wo • Four schools experienced a reduction in general education transportation services: Alice Fong Yu, Clarendon, Lilienthal, and Rooftop
Snapshot of Year 1 Changes 2010-11 (last year) 44 buses 58 elementary schools 5 middle schools 3,658 students 3,300 elementary 358 middle • 2011-12 (this year) • 38 buses • 47 elementary schools • 5 middle schools • 2,716 students • 2,400 elementary • 379 middle 8
Current Budget 2,400 K5 riders + 379 middle school riders = 2,779 ridersCost per student: $2,033 (approx.)
3 Year Budget Reduction Goals $6.8 $5.7 $3.9 $3.9
Modified Services- Elementary February 2011 Proposal – list to be finalized * Possible program change may impact transportation plan
Losing Services - ElementaryFebruary 2011 Proposal – list to be finalized • Currently analyzing to ensure proposal meets policy guidelines – list subject to change by mid-March 2012
3-Year Plan – Elementary School February 2011 Proposal – to be finalized
Implementing Year 2 – Timeline • Early March • Finalize routes and stops • Develop materials to engage and inform families • Mid March - April • Share information and gather feedback • April – May • Review feedback • Finalize routes • Launch request for service process
Implementing Year 2 – Middle • November 2011, shared information about middle school services for 2012-13 • Aptos, from Carver and Starr King • Francisco, from Treasure Island • Giannini, from Drew • Hoover, from Monroe, Moscone, and Serra • Lick, from Harte • Marina, from Treasure Island • Mid-March - share route specific information • Existing services will be redesigned • Services will be added to Marina
Implementing Year 2 – Elementary Mid-March 2012 • Memo to principals with data and rationale • Multilingual materials for families • Letter to families • Frequently Asked Questions • Family Feedback Form • Information about alternatives to yellow bus • Family input process • Letter to non-SFUSD after school providers
Options for Family Input • Early Education Schools – family support meetings • Feedback Forms (multilingual) • Transportation Department • EPC • School • Phone Transportation Families Principals & Site Managers Transportation Department LEAD Working Group
Alternatives to Yellow Bus • Safe Routes to School: www.sfsaferoutes.org • Walking School Bus: www.walksf.org • Family Biking: www.sfbike.org • SchoolPool: www.WePool2School.org • MUNI: www.sfmta.com
Immediate Next Steps Early March • Complete analysis of proposal to ensure adheres to policy guidelines • Develop multilingual materials for families (e.g., FAQ and family feedback forms) • Develop plan for family support meetings at Early Education Schools Mid-March • Announce changes
Appendix Overview of Current Services
Current Services – Middle School Services in 2012-13 will be redesigned
Current Services - Elementary • 47 elementary schools • More PM riders than AM riders • 1,761 students in the morning • 2,400 students in the evening • 62% of riders go to 17 schools • Lakeshore, Lilienthal, Rooftop, Ulloa, Carver, Sherman, Muir, Malcolm X, Alvarado, Carmichael, Spring Valley, Webster, Revere, Lawton, Stevenson, Parks, and Taylor
Current Services- After School Number of afternoon riders by location and by CTIP area • 38% of all riders go to a stop located in CITP1