Download
1 / 18
180 likes | 330 Vues
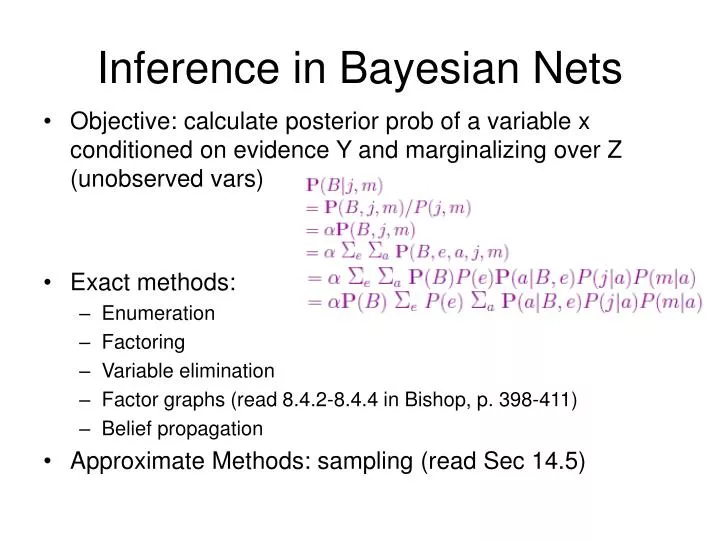
Inference in Bayesian Nets. Objective: calculate posterior prob of a variable x conditioned on evidence Y and marginalizing over Z (unobserved vars) Exact methods: Enumeration Factoring Variable elimination Factor graphs (read 8.4.2-8.4.4 in Bishop, p. 398-411) Belief propagation

E N D
Inference in Bayesian Nets • Objective: calculate posterior prob of a variable x conditioned on evidence Y and marginalizing over Z (unobserved vars) • Exact methods: • Enumeration • Factoring • Variable elimination • Factor graphs (read 8.4.2-8.4.4 in Bishop, p. 398-411) • Belief propagation • Approximate Methods: sampling (read Sec 14.5)
Factors • A factor is a multi-dimensional table, like a CPT • fAJM(B,E) • 2x2 table with a “number” for each combination of B,E • Specific values of J and M were used • A has been summed out • f(J,A)=P(J|A) is 2x2: • fJ(A)=P(j|A) is 1x2: {p(j|a),p(j|a)}
Pointwise product • given 2 factors that share some variables: • f1(X1..Xi,Y1..Yj), f2(Y1..Yj,Z1..Zk) • resulting table has dimensions of union of variables, f1*f2=F(X1..Xi,Y1..Yj,Z1..Zk) • each entry in F is a truth assignment over vars and can be computed by multiplying entries from f1 and f2
Factor Graph • Bipartite graph • variable nodes and factor nodes • one factor node for each factor in joint prob. • edges connect to each var contained in each factor
F(B) F(E) B E F(A,B,E) A F(J,A) F(M,A) J M
Message passing • Choose a “root” node, e.g. a variable whose marginal prob you want, p(A) • Assign values to leaves • For variable nodes, pass m=1 • For factor nodes, pass prior: f(X)=p(X) • Pass messages from var node v to factor u • Product over neighboring factors • Pass messages from factor u to var node v • sum out neighboring vars w
Terminate when root receives messages from all neighbors • …or continue to propagate messages all the way back to leaves • Final marginal probability of var X: • product of messages from each neighboring factor; marginalizes out all variables in tree beyond neighbor • Conditioning on evidence: • Remove dimension from factor (sub-table) • F(J,A) -> FJ(A)
Belief Propagation (this figure happens to come from http://www.pr-owl.org/basics/bn.php) see also: wiki, Ch. 8 in Bishop PR&ML
Computational Complexity • Belief propagation is linear in the size of the BN for polytrees • Belief propagation is NP-hard for trees with “cycles”
Inexact Inference • Sampling • Generate a (large) set of atomic events (joint variable assignments) <e,b,-a,-j,m> <e,-b,a,-j,-m> <-e,b,a,j,m> ... • Answer queries like P(J=t|A=f) by averaging how many times events with J=t occur among those satisfying A=f
Direct sampling • create an independent atomic event • for each var in topological order, choose a value conditionally dependent on parents • sample from p(Cloudy)=<0.5,0.5>; suppose T • sample from p(Sprinkler|Cloudy=T)=<0.1,0.9>, suppose F • sample from P(Rain|Cloudy=T)=<0.8,0.2>, suppose T • sample from P(WetGrass|Sprinkler=F,Rain=T)=<0.9,0,1>, suppose T event: <Cloudy,Sprinkler,Rain,WetGrass> • repeat many times • in the limit, each event occurs with frequency proportional to its joint probability, P(Cl,Sp,Ra,Wg)= P(Cl)*P(Sp|Cl)*P(Ra|Cl)*P(Wg|Sp,Ra) • averaging: P(Ra,Cl) = Num(Ra=T&Cl=T)/|Sample|
Rejection sampling • to condition upon evidence variables e, average over samples that satisfy e • P(j,m|e,b) <e,b,-a,-j,m> <e,-b,a,-j,-m> <-e,b,a,j,m> <-e,-b,-a,-j,m> <-e,-b,a,-j,-m> <e,b,a,j,m> <-e,-b,a,j,-m> <e,-b,a,j,m> ...
Likelihood weighting • sampling might be inefficient if conditions are rare • P(j|e) – earthquakes only occur 0.2% of the time, so can only use ~2/1000 samples to determine frequency of JohnCalls • during sample generation, when reach an evidence variable ei, force it to be known value • accumulate weight w=P p(ei|parents(ei)) • now every sample is useful (“consistent”) • when calculating averages over samples x, weight them: P(j|e) = aSconsistent w(x)=<SJ=T w(x), SJ=F w(x)>
Gibbs sampling (MCMC) • start with a random assignment to vars • set evidence vars to observed values • iterate many times... • pick a non-evidence variable, X • define Markov blanket of X, mb(X) • parents, children, and parents of children • re-sample value of X from conditional distrib. • P(X|mb(X))=aP(X|parents(X))*P P(y|parents(X)) for ychildren(X) • generates a large sequence of samples, where each might “flip a bit” from previous sample • in the limit, this converges to joint probability distribution (samples occur for frequency proportional to joint PDF)
Other types of graphical models • Hidden Markov models • Gaussian-linear models • Dynamic Bayesian networks • Learning Bayesian networks • known topology: parameter estimation from data • structure learning: topology that best fits the data • Software • BUGS • Microsoft