Download
1 / 12
120 likes | 232 Vues
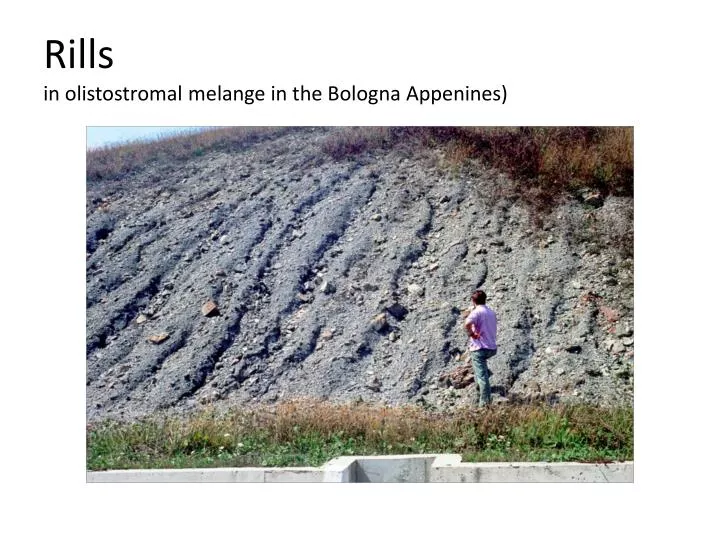
Rills in olistostromal melange in the Bologna Appenines ). Rainfall rate (intensity) mm/hr . Time (days). Stream discharge (m 3 /sec). Time (days). Rainfall rate (intensity) mm/hr . Time (days). Hydrograph:. peak. Stream discharge (m 3 /sec). Time (days). Rainfall rate

E N D
Rainfall rate (intensity) mm/hr Time (days) Stream discharge (m3/sec) Time (days)
Rainfall rate (intensity) mm/hr Time (days) Hydrograph: peak Stream discharge (m3/sec) Time (days)
Rainfall rate (intensity) mm/hr Time (days) Hydrograph: peak Stream discharge (m3/sec) Recession limb – period of falling stream flow after rainfall ceases Time (days)
Rainfall rate (intensity) mm/hr Time (days) Hydrograph: peak Stream discharge (m3/sec) Base flow = low flow btwn storms, and their equivalent during storms Time (days)
Rainfall rate (intensity) mm/hr Time (days) Hydrograph: peak Stream discharge (m3/sec) Storm runoff = runoff above projection of pre-storm flow Base flow = low flow btwn storms, and their equivalent during storms Time (days)
Rainfall rate (intensity) mm/hr Time (days) Lag to peak = Time from peak rainfall to peak stream flow Hydrograph: Stream discharge (m3/sec) Storm runoff = runoff above projection of pre-storm flow Base flow = low flow btwn storms, and their equivalent during storms Time (days)
Response times altered by land use! Build a parking lot ? Irrigate a field ? • HOF • Sat. overland flow
Runoff coefficient – ratio of total storm runoff (runoff above projection of pre-storm flow) total storm rainfall = Sum (rainfall) / Sum (runoff)
Qt = discharge at time t Qp = peak discharge Qt = Qp Kt K = recession constant (small K = fast recession) Qp : HOF > SOF > SSSF Lag to peak: HOF < SOF < SSSF K: HOF < SOF < SSSF
Darcy’s Law (groundwater discharge) Porosity: measure of total pore space (not necessarily interconnected) Permeability: volume fraction of interconnected pores Aquifer: permeable rocks and sediments that store groundwater Water table: upper surface of saturated zone in an aquifer Darcy’s Law: groundwater discharge (Q) per cross sectional area (A) of an aquifer is proportional to the hydraulic gradient (slope of water table surface) To the board…