Download
1 / 17
180 likes | 311 Vues
Regional Air-Sea Interactions in Eastern Pacific. Hyodae Seo Scripps Institution of Oceanography. 6th International RSM Workshop Palisades, New York July 11-15, 2005. Outline. 1. Regional Ocean Atmosphere Coupled Model 2. Research

E N D
Regional Air-Sea Interactions in Eastern Pacific Hyodae Seo Scripps Institution of Oceanography 6th International RSM Workshop Palisades, New York July 11-15, 2005
Outline • 1. Regional Ocean Atmosphere Coupled Model • 2. Research 1. Gap-Induced Low-Level Winds and Air-Sea Interaction in Central America 2. Atmospheric Boundary Layer Adjustment to Tropical Instability Waves (TIWs) in Eastern Tropical Pacific • 3. Summary
1. Model and Coupler Description Regional Ocean-Atmosphere Coupled Model • Bulk Formula in BL Atmosphere • Winds Relative to Ocean Ocean Boundary Layer Variables Regional Spectral Model (RSM) COARE Bulk Formula Plus Winds relative to ocean currents Regional Ocean Modeling System (ROMS) • Sequential Coupling • Coupling Frequency • 3 hourly coupling • Daily coupling SST Lateral BC: Ocean Data Assimilation Product (JPL) IC and Lateral BC: NCEP/DOE Reanalysis
Gap-Induced Low-level Winds and Air-Sea Interaction in Central America OBSERVATION: Xie et al., 2005 Jan-Mar SST and Windstress Climatology Tehuantepec Papagayo Panama
2.1. Gap Winds and Air-Sea Interaction 1999-2003 Model Climatology Sea Surface Temperature (C) Ekman Pumping Velocity (10^-6 m/s) Precipitation (mm/day) Winter Winter Winter Tehuantepec Papagayo Panama Costa Rica Dome Upwelling by Papagayo Jet Summer Summer Summer Cold SST Dry Hole
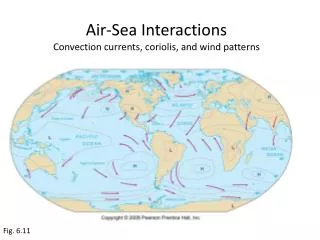
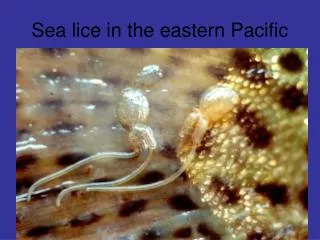
Atmospheric Boundary Layer Response to Tropical Instability Waves (TIWs) in Eastern Tropical Pacific Global SST Image from microwave satellites Aug 25-27, 1999 (Wentz et al.) Tropical Instability Waves (TIWs)
2.2 Atmospheric BL Adjustment to SSTsa. Winds and SST June 21 – October 20 1999 OBSERVED SSTs MODEL SST • 3 month average of wind-stress and SST • Similar gross • patterns of winds and • SST during • TIWs season MODEL Wind Stress OBSERVED Wind Stress Chelton et al., 2001
2.2 Atmospheric BL Adjustment to SSTsb. Temporal/Spatial Associations Tropical Instability Waves (TIWs) and Winds MODEL: 1999 - 2003 along 2N SST Stress Div June 2003 Jun - Dec. 1999 SST June 2002 June 2001 Wind Stress June 2000 Wind-Divergence June 1999
2.2 Atmospheric BL Adjustment to SSTsc. Stability of Atmospheric BL Due to SSTs Typical TIWs and Winds September 2 - 4, 1999 Atmospheric Temp Warm Phase: 173, Cold Phase: 217 UNSTABLE September 2 - 18, 1999 Specific Humidity Vir. Pot. Temp. STABLE Ocean Temp UNSTABLE STABLE U-Wind V-Wind
2.2 Atmospheric BL Adjustment to SSTsd. Isotherms and Wind Vectors: Dynamic Feedback Typical Patterns of Winds and SST Chelton, 2001 MODEL OBSERVATION Wind Stress Divergence Wind Stress Divergence Wind Stress Curl Wind Stress Curl Chelton, 2005 Implication of DYNAMIC FEEDBACK
2.2 Atmospheric BL Adjustment to SSTse. Thermodynamic Feedback MODEL SIMULATION Less Cooling Latent Heat Flux Latent and Sensible Heat Flux damp the SST anomaly; Turbulent flux provides NEGATIVE FEEDBACK To SST by TIWs. More Cooling Sensible Heat Flux
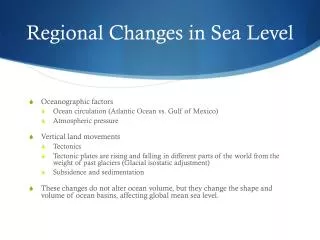
3. Summary • High-resolution ocean-atmosphere coupled model has been developed to study air-sea interactions in various parts of the World Ocean. • Mesoscale SST induces atmospheric boundary layer adjustment, which may feed back onto ocean. • Central American gap winds force upper ocean thermocline topography, which in turn affects atmospheric deep convection and precipitation.
Southern California Coast Over Warm Eddies: ~ 100km Wind Stress Curl SST & Wind Stress Wind Stress Curl Wind Stress Div Latent Heat Flux Additional Example of relations between wind stress vector and isotherms in southern California coastal ocean
Model Bias: Low-level CloudinessEastern Pacific • Stratus/Stratocumulus are overestimated over south east Pacific (because of colder SSTs in model?) 1999-2000 Mean Low-level Cloud OBSERVATION MODEL 1999-2003 Mean SST OBSERVATION MODEL Month Month Month Longitude Longitude Longitude Longitude