Download
1 / 24
240 likes | 454 Vues
Summary Statistics Review. MIS2502 Data Analytics. Bottom line. In large sets of data, these patterns aren’t obvious And we can’t just figure it out in our head We need analytics software We’ll be using SAS to perform these three analyses on large sets of data Decision Trees Clustering

E N D
Summary Statistics Review MIS2502 Data Analytics
Bottom line • In large sets of data, these patterns aren’t obvious • And we can’t just figure it out in our head • We need analytics software • We’ll be using SAS to perform these three analyses on large sets of data • Decision Trees • Clustering • Association Rules
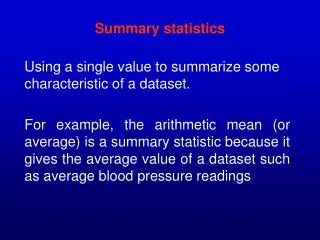
Do most players make more or less than the mean? Explain. • Are player salaries normally distributed? Explain. • What do you learn about player salaries based on the standard deviation being greater than the mean?
SAS #1 – Intro • Start up SAS • Modify an existing Project • Create a new Diagram within that Project • Define Data Set AAEM61.Organics for that Project • Modify Data Set AAEM61.Organics • DemCluster:Reject • TargetAmt: Reject • TargetBuy: Target – Binary Analysis (during Data Source Definition) Target Buy - Proportion who Purchase Explore Data Source Organics • DemGender (BAR Chart) • DemAge (Summary Stats Max) • Distribution of DemAffl - Mode v Mean
File >New > Diagram File>New>Data Source
SAS #1- Data Source Wizard : Step 2Browse to SharedData>Libraries> AAEM >Organics OK
SAS #1- Data Source Wizard : Next for Steps 3, 4 and 5 . Basic and then make changes
SAS #1- Data Source Wizard : Next for Steps 7, 8, 9 and 10, then Finish.
SAS #1 – Explore Right Click on file and Choose Explore This will open the Summary Statistics window
SAS #1 - Explore Using Histogram Actions>Plot>Histogram> Highlight bars to get Stats
SAS #1 - Explore Using Histogram Actions>Plot>Histogram> Answer will vary depending on fetch size and sample method but not by much…
SAS Homework 2 Review Decision Trees • Using Organics Data Set from exercise #1. If Organics is wrong then your Decision Tree will be wrong • Partition: 50% Training, 50% Validation • Add a Decision Tree using defaults (max number branches 2) • Evaluate default Decision Tree using Average Square Error • Add another Decision Tree but this time customize by changing the max number of branches from 2 to 3 • Assess this Decision Tree using Average Square Error • Compare default Tree (2 branch max) to customized Tree (3 branch max) and determine which model is ‘better’ • Answer some questions regarding the customized Decision Tree
Decision Tree – Diagram • Right Click> Run after adding objects • Difference is Maximum Branch
Assessing the 1st Decision Tree • 2 branches • Age is 1st branch
Assessing the 1st Decision Tree using average square error subtree assessment plot • The line is the Optimal Leaf count for that tree • Note the Leaf Count and the Validation: Average Square Error • View>Model>Subtree Assessment Plot
Assessing the 2nd Decision Tree • Note change in average square error • In general, less error is better
Navigating the Tree What is the probability that a 39.5 year old male with an affluence grade of 15 buys organics ? • Age = 39.5, • AfflGrade > 11.5 • Gender = M • Look at the ‘Validation’ stats • 1 = buy, 0 = no buy