Download
1 / 1
10 likes | 200 Vues
Phosphorous Management %of Patients with PO4 > 3.5 & < 5.5 mg/dL Due Dates: August 31, 2009, November 30, 2009 & February 26, 2010. US CPM Average 52. %. Facility Name: ____________________ Provider/CCN#:_ _ - _ _ _ _. TX QOC Average 50.5. MRB Cutpoint < 40. 2009.

E N D
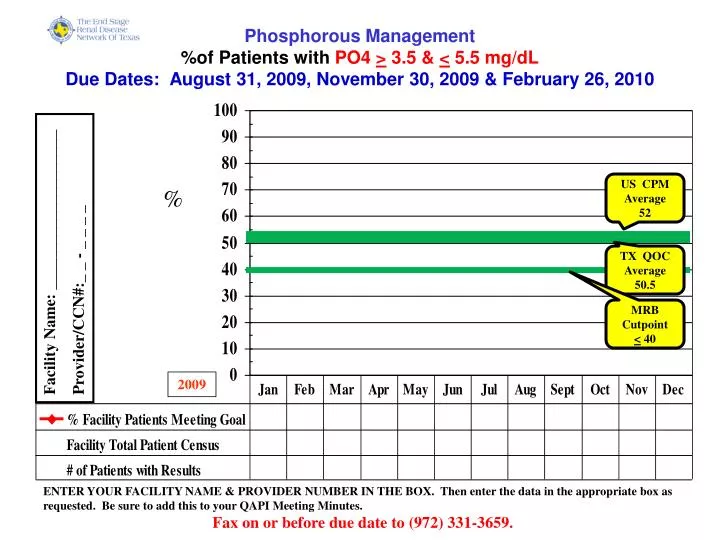
Phosphorous Management %of Patients with PO4 > 3.5 & < 5.5 mg/dLDue Dates: August 31, 2009, November 30, 2009 & February 26, 2010 US CPM Average 52 % Facility Name: ____________________ Provider/CCN#:_ _ - _ _ _ _ TX QOC Average 50.5 MRB Cutpoint < 40 2009 ENTER YOUR FACILITY NAME & PROVIDER NUMBER IN THE BOX. Then enter the data in the appropriate box as requested. Be sure to add this to your QAPI Meeting Minutes. Fax on or before due date to (972) 331-3659.