Download
1 / 22
230 likes | 393 Vues
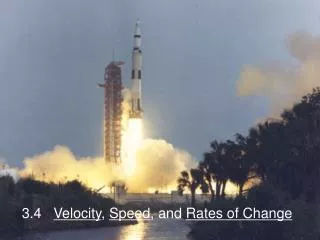
3.4 Velocity, Speed, and Rates of Change. downward. -256. 2, 8. X=3, 7. 64. -32. B. distance (miles). A. time (hours). (The velocity at one moment in time.). Consider a graph of displacement (distance traveled) vs. time. Average velocity can be found by taking:.

E N D
downward -256 2, 8
X=3, 7 64 -32
B distance (miles) A time (hours) (The velocity at one moment in time.) Consider a graph of displacement (distance traveled) vs. time. Average velocity can be found by taking: The speedometer in your car does not measure average velocity, but instantaneous velocity.
Gravitational Constants: Speed is the absolute value of velocity. Example: Free Fall Equation
Acceleration is the derivative of velocity. example: If distance is in: Velocity would be in: Acceleration would be in:
distance time It is important to understand the relationship between a position graph, velocity and acceleration: acc neg vel pos & decreasing acc neg vel neg & decreasing acc zero vel neg & constant acc zero vel pos & constant acc pos vel neg & increasing velocity zero acc pos vel pos & increasing acc zero, velocity zero
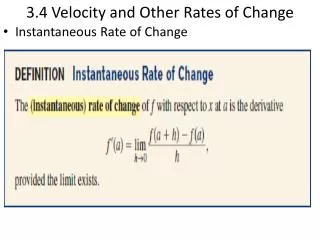
Average rate of change = Instantaneous rate of change = Rates of Change: These definitions are true for any function. ( x does not have to represent time. )
For tree ring growth, if the change in area is constant then dr must get smaller as r gets larger. Example 1: For a circle: Instantaneous rate of change of the area with respect to the radius.
4 2 4 6 -4 Particle Motion • A particle P moves back and forth on the number line. The graph below shows the position of P as a function of time. • Describe the motion of the particle over time. • Graph the particle’s velocity and speed (where defined).
4 2 2 4 6 -2 -4 Particle Motion Particle is moving right when P‘(t) > 0 or (0,1) Particle is moving left when P’(t) < 0 or (2,3), (5,6) Particle is standing still when P’(t) = 0 or (1,2), (3,5)
from Economics: Marginal cost is the first derivative of the cost function, and represents an approximation of the cost of producing one more unit.
Note that this is not a great approximation – Don’t let that bother you. The actual cost is: Example 13: Suppose it costs: to produce x stoves. If you are currently producing 10 stoves, the 11th stove will cost approximately: marginal cost actual cost
Note that this is not a great approximation – Don’t let that bother you. Marginal cost is a linear approximation of a curved function. For large values it gives a good approximation of the cost of producing the next item. p
0 y = 12x - 35 12
slope Consider the function We could make a graph of the slope: Now we connect the dots! The resulting curve is a cosine curve.
slope We can do the same thing for The resulting curve is a sine curve that has been reflected about the x-axis.
We can find the derivative of tangent x by using the quotient rule.
Derivatives of the remaining trig functions can be determined the same way. p