Download
1 / 42
420 likes | 547 Vues
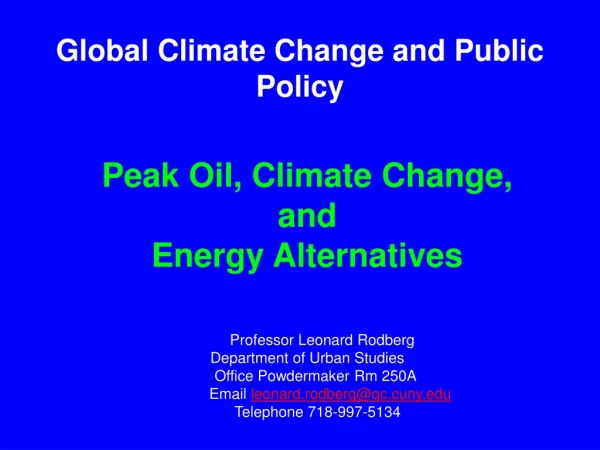
Global Climate Change and Public Policy. Peak Oil, Climate Change, and Energy Alternatives Professor Leonard Rodberg Department of Urban Studies Office Powdermaker Rm 250A Email leonard.rodberg@qc.cuny.edu Telephone 718-997-5134. 2004. US Oil Production and Imports.

E N D
Global Climate Change and Public Policy Peak Oil, Climate Change, and Energy Alternatives Professor Leonard Rodberg Department of Urban Studies Office Powdermaker Rm 250A Email leonard.rodberg@qc.cuny.edu Telephone 718-997-5134
2004 US Oil Production and Imports
The Time Course of Production of any Non-renewal Resource according to M. King Hubbert
2004 US Oil Production and Imports
The Paper that Started It All… *Publication No. 95,Shell Development Company, Exploration and Production Research Division, Houston, Texas **Chief Consultant (General Geology).
Taking the Long View: The History of the Human Race according to M. King Hubbert
Human and Natural Drivers of Climate Change The Long View CO2, CH4 and N2O Concentrations - far exceed pre-industrial values - increased markedly since 1750 due to human activities Relatively little variation before the industrial era
What are the Greenhouse Gases? • Carbon Dioxide (CO2) • Methane (CH4) Principal Source: Burning of Fossil Fuels: Oil, natural gas/methane, coal Hydrocarbons (CnHm)) + Oxygen (O2) CO2 + H2O Also Nitrous Oxide (N2O) Chlorofluorocarbons (CFCs)
Carbon, and Fossil Fuels, are the Culprit Radiative Forcing Components
Direct Observation of Recent Climate Change At continental, regional, and ocean basin scales, numerous long-term changes in climate have been observed. These include: • Changes in Arctic temperatures and ice, • Widespread changes in precipitation amounts, ocean salinity, wind patterns • and aspects of extreme weather including droughts, heavy precipitation, heat waves and the intensity of tropical cyclones
Declining Sea Ice http://www.pewclimate.org/global-warming-basics/facts_and_figures/impacts/lateseaice.cfm
Impacts Worldwide Spreading disease Coral reef bleaching Heat waves and periods of unusually warm weather Downpours, heavy snowfalls, and flooding Glaciers melting Earlier spring arrival Plant and animal range shifts and population declines Sea level rise and coastal flooding Arctic and Antarctic warming Droughts and fires GLOBAL WARMING: Early Warning Signs Fingerprints and Harbingers www.climatehotmap.org
Why Not Natural Gas? Natural gas causes more global warming but less air pollution mortality than coal over 150 years due to less sulfate (a cooling agent) and more methane (a warming agent) from natural gas than coal. Coal causes higher mortality. 50-70 times more CO2 and air pollution per kWh than wind Hydrofracking causes land and water supply degradation
Why Not Nuclear? 9-25 times more pollution per kWh than wind from mining & refining uranium, using fossil fuels for electricity during the 11-19 years to permit (6-10 y) and construct (4-9 y) nuclear plant compared with 2-5 years for a wind or solar farm Risk of meltdown (1.5% of all nuclear reactors to date have melted) Risk of nuclear weapons proliferation Unresolved waste issues
Why Not Ethanol? Corn and cellulosic E85 cause same or higher air pollution as gasoline -- Corn E85: 90-200% of CO2 emissions of gasoline -- Cellulosic E85: 50-150% of CO2 emissions of gasoline Wind: <1% of CO2 emissions as gasoline Enormous land use and water requirements
U.S. Carbon Stabilization via Wedges Source: Lashof and Hawkins, NRDC, in Socolow and Pacala, Scientific American, September 2006, p. 57
Wind Electricity Wind Electricity • Effort needed by 2055 for 1 wedge: • One million 2-MW windmills displacing coal power. • Today: 50,000 MW (1/40) Prototype of 80 m tall Nordex 2,5 MW wind turbine located in Grevenbroich, Germany (Danish Wind Industry Association)
Nuclear Electricity Effort needed by 2055 for 1 wedge: 700 GW (twice current capacity) displacing coal power. Nuclear Electricity Phase out of nuclear power creates the need for another half wedge. Site: Surry station, James River, VA; 1625 MW since 1972-73. Credit: Dominion. A revised goal: retrievable storage Natural-U plants (no enrichment), no reprocessing Universal rules and international governance
Efficient Use of Electricity Efficient Use of Electricity lighting motors cogeneration Effort needed by 2055 for 1 wedge: . 25% reduction in expected 2055 electricity use in commercial and residential buildings Target commercial and multifamily buildings.
Efficient Use of Fuel Efficient Use of Fuel Effort needed by 2055 for 1 wedge: Note: 1 car driven 10,000 miles at 30 mpg emits 1 ton of carbon. 2 billion cars driven 10,000 miles per year at 60 mpg instead of 30 mpg. 2 billion cars driven, at 30 mpg, 5,000 instead of 10,000 miles per year. • Property-tax systems that reinvigorate cities and discourage sprawl
Carbon Storage Carbon Storage Effort needed by 2055 for 1 wedge: 3500 Sleipners @1 MtCO2/yr 100 x U.S. CO2 injection rate for EOR A flow of CO2 into the Earth equal to the flow of oil out of the Earth today Sleipner project, offshore Norway Graphic courtesy of David Hawkins Graphic courtesy of Statoil ASA
Saving Energy in NYC Source: L. Rodberg and G. Stokes, The Village Voice, Feb. 18, 1980
Both Adaptation and Mitigation:Mayor’s PlaNYC Adapts to Some Inevitable Climate Change • Protect our city’s vital infrastructure • Work with vulnerable neighborhoods to develop site-specific strategies • Launch a citywide strategic planning process for climate change adaptation