Download
1 / 17
170 likes | 177 Vues
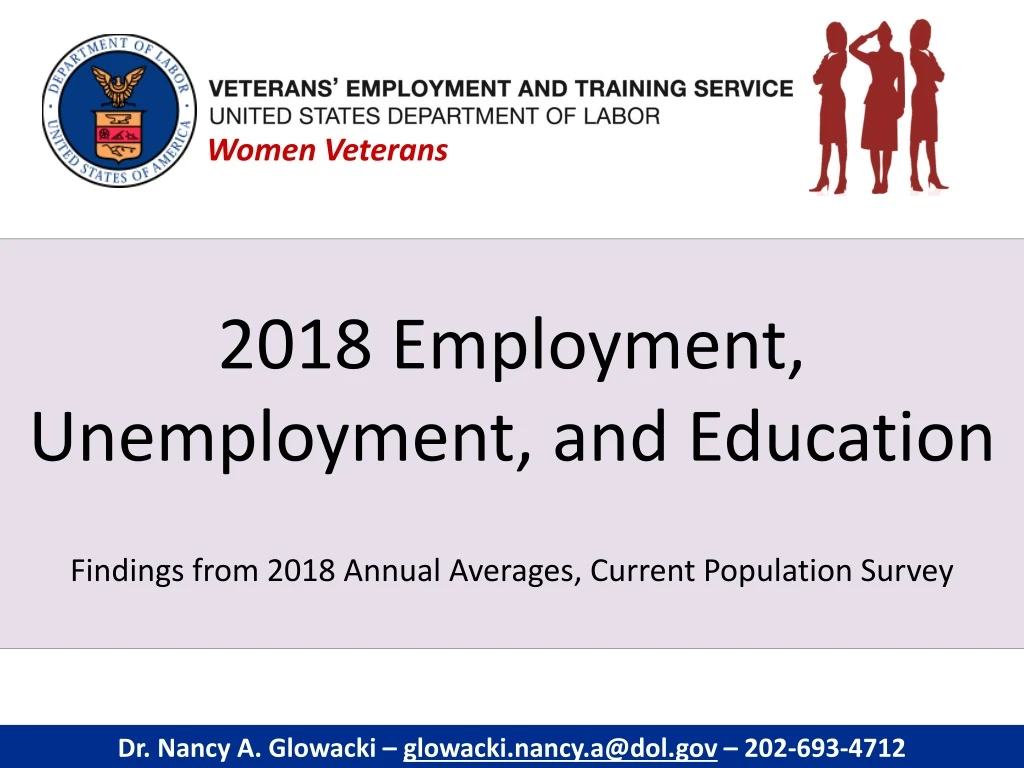
Women Veterans. 2018 Employment, Unemployment, and Education Findings from 2018 Annual Averages, Current Population Survey. Dr. Nancy A. Glowacki – glowacki.nancy.a@dol.gov – 202-693-4712. Employment Rates, Unemployment Rates, and Educational Attainment.

E N D
Women Veterans 2018 Employment, Unemployment, and EducationFindings from 2018 Annual Averages, Current Population Survey Dr. Nancy A. Glowacki – glowacki.nancy.a@dol.gov – 202-693-4712
Employment Rates, Unemployment Rates, and Educational Attainment
Women veterans are more likely than male veterans to be employed The employment-population ratio is the percent of the civilian noninstitutional population who are employed U.S. Department of Labor, Bureau of Labor Statistics, 2018 Current Population Survey, Annual Averages, Unpublished Tables (Calculations done within VETS)
Women veterans are less likely than male veterans to usually work full-time, but more likely than women nonveterans to usually work full-time (compared to part-time work) U.S. Department of Labor, Bureau of Labor Statistics, 2018 Current Population Survey, Annual Averages, Unpublished Tables (Calculations done within VETS)
In 2018, the unemployment rate of all women veterans was lower than that of male veterans or nonveterans of either gender, however these differences are not statistically significant* The unemployment rate is the percent of the labor force who are not currently working, but are available for work and actively seeking work * margin of error at 90% confidence interval: male veterans +/- .3, male nonveterans +/- .1, women veterans +/- .7, women nonveterans +/- .1 U.S. Department of Labor, Bureau of Labor Statistics, 2018 Current Population Survey, Annual Averages, Unpublished Tables (Calculations done within VETS)
The average duration of unemployment is longer for women veterans than for male veterans or nonveterans of either gender U.S. Department of Labor, Bureau of Labor Statistics, 2018 Current Population Survey, Annual Averages, Unpublished Tables (Calculations done within VETS)
Educational Attainment Educational Attainment
Women veterans are more likely than male veterans to have some college or to be college graduates Women veterans are more likely than nonveterans to have some college or to be college graduates U.S. Department of Labor, Bureau of Labor Statistics, 2018 Current Population Survey, Annual Averages, Unpublished Tables (Calculations done within VETS)
Women veterans are more likely than male veterans to be enrolled in school Among women 25-54 years old, veterans are twice as likely as nonveterans to be enrolled in school U.S. Department of Labor, Bureau of Labor Statistics, 2018 Current Population Survey, Annual Averages, Unpublished Tables (Calculations done within VETS)
Among 18-54 year olds enrolled in school, veterans are more likely than nonveterans to be in the labor force U.S. Department of Labor, Bureau of Labor Statistics, 2018 Current Population Survey, Annual Averages, Unpublished Tables (Calculations done within VETS)
Among 18-54 year olds enrolled in school and seeking employment, veterans are more likely than nonveterans to be seeking full-time work (compared to part-time work) U.S. Department of Labor, Bureau of Labor Statistics, 2018 Current Population Survey, Annual Averages, Unpublished Tables (Calculations done within VETS)
Unemployment Rates Unemployment Rates
Unemployment Rates, continued U.S. Department of Labor, Bureau of Labor Statistics, 2018 Current Population Survey, Annual Averages, Unpublished Tables (Calculations done within VETS)
The highest unemployment rates are among 18-54 year olds enrolled in school U.S. Department of Labor, Bureau of Labor Statistics, 2018 Current Population Survey, Annual Averages, Unpublished Tables (Calculations done within VETS)
In 2018 there were 22,000 unemployed 18-54 year old veterans enrolled in school Among these, 23% (5,000) were women veterans U.S. Department of Labor, Bureau of Labor Statistics, 2018 Current Population Survey, Annual Averages, Unpublished Tables (Calculations done within VETS)
DOL VETS Women Veteran webpage Women Veterans www.dol.gov/vets/womenveterans
Closing Slide Women Veterans Dr. Nancy A. Glowacki – glowacki.nancy.a@dol.gov – 202-693-4712