Download
1 / 11
110 likes | 292 Vues
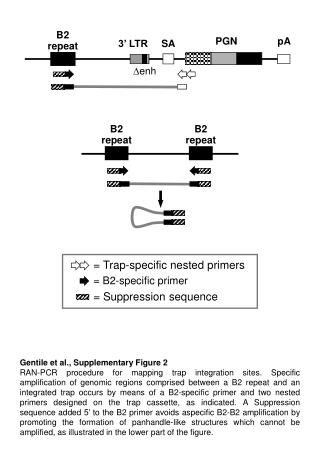
Measuring Repeat and Near-Repeat Burglary Effects. Martin B. Short, Maria R. D’Orsogna, P. Jeffrey Brantingham, George E. Tita. Maria Pavlovskaia. Repeat and Near-Repeat Victimization. Criminals likely to revisit crime scene Likely to rob neighbors of previous victims. Why?.

E N D
Measuring Repeat and Near-Repeat Burglary Effects Martin B. Short, Maria R. D’Orsogna, P. Jeffrey Brantingham, George E. Tita Maria Pavlovskaia
Repeat and Near-Repeat Victimization • Criminals likely to revisit crime scene • Likely to rob neighbors of previous victims
Why? • Knowledge of entry modes and security • Easy access to site • Abundance of material possessions • Knowledge of neighbor’s daily routines
Data analysis • Measured the distribution of wait times between successive burglaries • Rapidly decaying function • Conclusion: houses likely to be robbed again within a short period of time of a burglary • Thus repeat victimization hypothesis is true?
Random Event Hypothesis • Burglaries occur at random with rate • Poisson process • Wait times exponentially distributed
Testing the REH Two different counting methods • Sliding window method • Monitors each house for max days after burglary • Count the number of burglaries occur in that time • Fixed window method • Classify houses by number of times robbed • Look at the distribution of wait times in each class
Sliding Window Method • Sample contains D days of data • Data split into N blocks with crime rates i • Corresponding weights wi • Predicted distribution:
Sliding Window Method • Long Beach Data Set 3
Fixed Window Method • Sample contains D days of data • Only focus on houses robbed twice • Predicted distribution:
Fixed Window Method • Long Beach Data Set
REH disproved • Robberies are correlated as hypothesized • Data supports the exact-repeat hypothesis • Burglarized houses likely to be struck again • Data also supports near-repeat hypothesis