Download
1 / 1
10 likes | 122 Vues
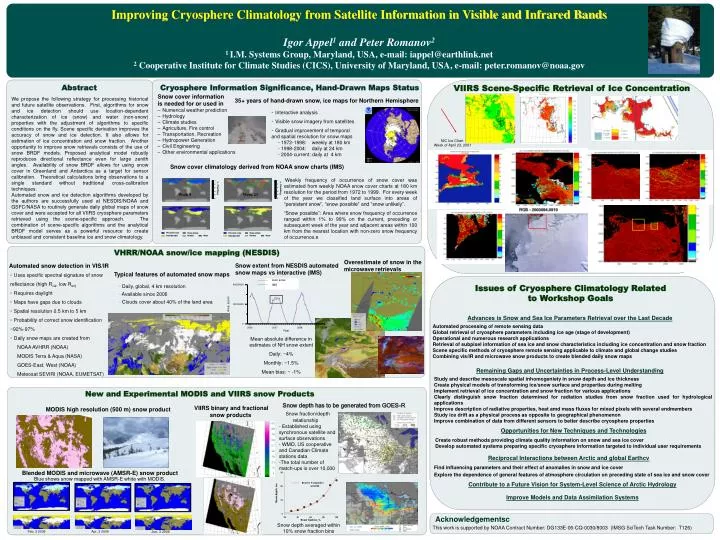
Auto snow. IMS. Week 9. Week 23. a=0.033. Improving Cryosphere Climatology from Satellite Information in Visible and Infrared Bands Igor Appel 1 and Peter Romanov 2 1 I.M. Systems Group, Maryland, USA, e-mail: iappel@earthlink.net

E N D
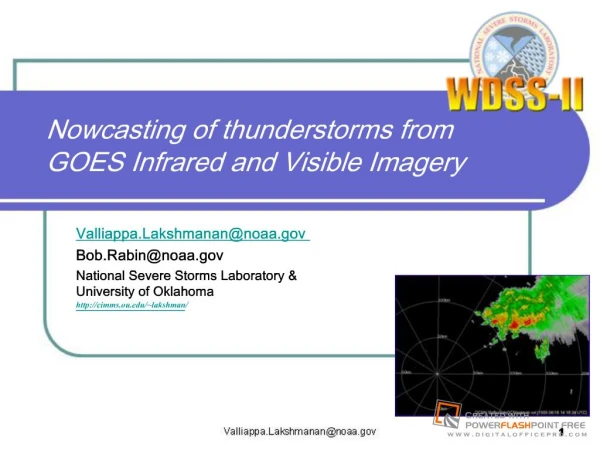
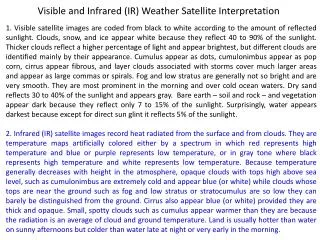
Auto snow IMS Week 9 Week 23 a=0.033 Improving Cryosphere Climatology from Satellite Information in Visible and Infrared Bands Igor Appel1 and Peter Romanov2 1 I.M. Systems Group, Maryland, USA, e-mail: iappel@earthlink.net 2 Cooperative Institute for Climate Studies (CICS), University of Maryland, USA, e-mail: peter.romanov@noaa.gov Abstract Cryosphere Information Significance, Hand-Drawn Maps Status VIIRS Scene-Specific Retrieval of Ice Concentration Snow cover information is needed for or used in • Numerical weather prediction • Hydrology • Climate studies • Agriculture, Fire control • Transportation, Recreation • Hydropower Generation • Civil Engineering • Other environmental applications We propose the following strategy for processing historical and future satellite observations. First, algorithms for snow and ice detection should use location-dependent characterization of ice (snow) and water (non-snow) properties with the adjustment of algorithms to specific conditions on the fly. Scene specific derivation improves the accuracy of snow and ice detection. It also allows for estimation of ice concentration and snow fraction. Another opportunity to improve snow retrievals consists of the use of snow BRDF models. Proposed analytical model robustly reproduces directional reflectance even for large zenith angles. Availability of snow BRDF allows for using snow cover in Greenland and Antarctica as a target for sensor calibration. Theoretical calculations bring observations to a single standard without traditional cross-calibration techniques. Automated snow and ice detection algorithms developed by the authors are successfully used at NESDIS/NOAA and GSFC/NASA to routinely generate daily global maps of snow cover and were accepted for all VIIRS cryosphere parameters retrieved using the scene-specific approach. The combination of scene-specific algorithms and the analytical BRDF model serves as a powerful resource to create unbiased and consistent baseline ice and snow climatology. 35+ years of hand-drawn snow, ice maps for Northern Hemisphere • Interactive analysis • Visible snow imagery from satellites • Gradual improvement of temporal and spatial resolution for snow maps • - 1972-1998: weekly at 180 km • - 1998-2004: daily at 24 km • - 2004-current: daily at 4 km NIC Ice Chart Week of April 23, 2001 Snow cover climatology derived from NOAA snow charts (IMS) Weekly frequency of occurrence of snow cover was estimated from weekly NOAA snow cover charts at 180 km resolution for the period from 1972 to 1999. For every week of the year we classified land surface into areas of “persistent snow”, “snow possible” and “snow unlikely”. “Snow possible”: Area where snow frequency of occurrence ranged within 1% to 99% on the current, preceding or subsequent week of the year and adjacent areas within 100 km from the nearest location with non-zero snow frequency of occurrence.e VHRR/NOAA snow/ice mapping (NESDIS) Automated snow detection in VIS/IR Overestimate of snow in the microwaveretrievals Snow extent from NESDIS automated snow maps vs interactive (IMS) Typical features of automated snow maps • Uses specific spectral signature of snow • reflectance (high Rvis, low Rsir) • Requires daylight • Maps have gaps due to clouds • Spatial resolution 0.5 km to 5 km • Probability of correct snow identification • ~92%-97% • Daily snow maps are created from • NOAA AVHRR (NOAA) • MODIS Terra & Aqua (NASA) • GOES-East, West (NOAA) • Meteosat SEVIRI (NOAA, EUMETSAT) • Daily, global, 4 km resolution • Available since 2006 • Clouds cover about 40% of the land area Issues of Cryosphere Climatology Related to Workshop Goals Advances is Snow and Sea Ice Parameters Retrieval over the Last Decade • Automated processing of remote sensing data • Global retrieval of cryosphere parameters including ice age (stage of development) • Operational and numerous research applications • Retrieval of subpixel information of sea ice and snow characteristics including ice concentration and snow fraction • Scene specific methods of cryosphere remote sensing applicable to climate and global change studies • Combining vis/IR and microwave snow products to create blended daily snow maps Mean absolute difference in estimates of NH snow extent Daily: ~4% Monthly: ~1.5% Mean bias: ~ -1% Remaining Gaps and Uncertainties in Process-Level Understanding Study and describe mesoscale spatial inhomogeniety in snow depth and ice thickness Create physical models of transforming ice/snow surface and properties during melting Implement retrieval of ice concentration and snow fraction for various applications Clearly distinguish snow fraction determined for radiation studies from snow fraction used for hydrological applications Improve description of radiative properties, heat amd mass fluxes for mixed pixels with several endmembers Study ice drift as a physical process as opposite to geographical phenomenon Improve combination of data from different sensors to better describe cryosphere properties New and Experimental MODIS and VIIRS snow Products Snow depth has to be generated from GOES-R VIIRS binary and fractional snow products MODIS high resolution (500 m) snow product • Snow fraction/depth relationship • Established using synchronous satellite and surface observations • WMO, US cooperative and Canadian Climate stations data • The total number of match-ups is over 10,000 Opportunities for New Techniques and Technologies Create robust methods providing climate quality information on snow and sea ice cover Develop automated systems preparing specific cryosphere information targeted to individual user requirements Reciprocal Interactions between Arctic and global Earthcv Find influencing parameters and their effect of anomalies in snow and ice cover Explore the dependence of general features of atmosphere circulation on preceding state of sea ice and snow cover Blended MODIS and microwave (AMSR-E) snow product Conclusions Blue shows snow mapped with AMSR-E white with MODIS. Contribute to a Future Vision for System-Level Science of Arctic Hydrology Improve Models and Data Assimilation Systems Acknowledgementsc Snow depth averaged within 10% snow fraction bins This work is supported by NOAA Contract Number: DG133E-06-CQ-0030/8003 (IMSG SciTech Task Number: T126)