Download
1 / 2

E N D
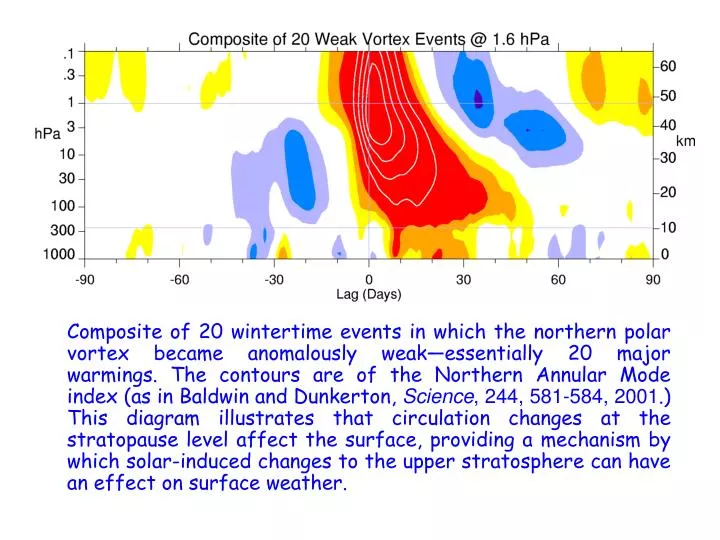
Composite of 20 wintertime events in which the northern polar vortex became anomalously weak—essentially 20 major warmings. The contours are of the Northern Annular Mode index (as in Baldwin and Dunkerton, Science, 244, 581-584, 2001.) This diagram illustrates that circulation changes at the stratopause level affect the surface, providing a mechanism by which solar-induced changes to the upper stratosphere can have an effect on surface weather.
Quasi-Biennial Oscillation (QBO) in ERA-40 reanalysis data (east-west composite). The ERA-40 data set has allowed us to see a new feature in the QBO—the positive anomaly near 1 hPa. This appears to be important because it links solar-ozone temperature changes in this region to changes in the strength of the polar vortex. The upper stratospheric effect (black arrow) may be more important than the middle stratospheric effect (gray arrow). Further details are in Pascoe et al., submitted to the Quarterly Journal (available at www.nwra.com/baldwin).