Download
1 / 41
410 likes | 415 Vues
Scientific communication: the power of avoiding words. Summerschool, University of São Paulo, February 4 th 2016. Danny Verboekend. Scientific communication: the power of avoiding words. Summerschool, University of São Paulo, February 4 th 2016. “a picture speaks a thousand words”.

E N D
Scientific communication: the power of avoiding words Summerschool, University of São Paulo, February 4th 2016 Danny Verboekend
Scientific communication: the power of avoiding words Summerschool, University of São Paulo, February 4th 2016 “a picture speaks a thousand words”
Scientific communication:the power of avoiding words Summerschool, University of São Paulo, February 4th 2016 or: “nobody likes to read”
Background Born: Nieuwegein, Netherlands (1980s) PhD: 2008-2010 ICIQ Spain PhD: 2010-2012 ETH Zurich, Switzerland Post-doc: 2012-2014: ETH Zurich, Switzerland Post-doc: 2014-current: KU Leuven
Scientific background • Heterogeneous catalysis • Adsorption • Zeolites • Catalyst design • Oil-derived feedstocks • Biomass-derived feedstocks
Feedstock Conversion Output
Feedstock Conversion Output
Feedstock Conversion Output
Feedstock Conversion Output
Feedstock Conversion Output
Feedstock Conversion Output power chemicals
Outline • Role of display items in science • Making figures: what (not) to do • Artwork in PowerPoint • Modifying pictures in PowerPoint • Animations in PowerPoint • Examples
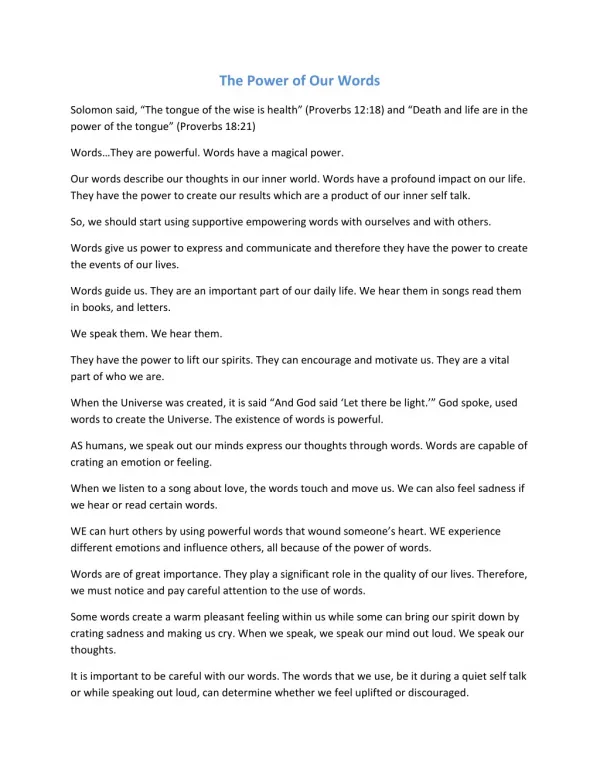
1. Role of display items in Science • Texts and tables are hard to comprehend • Time is limited nowadays • Nobody reads a paper entirely • Statements have a lot moreimpact when supported by figures • Figures avoid unambiguity
1. Types of display items Feedstock • Data figures Most abundant • Flow charts • Schematic summaries Output Conversion
2. Figures in Science: General Tips • Figures First! • Structure your article/chapter based on the figures • Text acts in favour of the figures • Figures can act as a guide in writing • Do not duplicate! • Data presented in figures (or tables) does not need to be repeated in the text. • Plot till you drop! • Many trends become clear only after thorough digging • Critical on the ´state of the art´? Prove it in a figure!
2. Making figures: a science on itself • X-ray diffraction patterns of zeolites: • Crystalline nature of zeolites yields very sharps and intense peaks • Position first,intensity second What is wrong here? a.u.
2. Making figures: a science on itself • No need for 3D • Labels missing • Font sizes • Empty spaces • Scaling subtoptimal • Inconsistent units • Range 10-30 is most interesting • Arbitrary units (a.u.) do not need to be defined a.u.
2. Making figures: a science on itself • No need for 3D • Labels missing • Font sizes • Empty spaces • Scaling subtoptimal • Inconsistent units • Range 10-30 is most interesting • Arbitrary units (a.u.) do not need to be defined D C B A
2. Making figures: a science on itself Guilty as charged!
2. Making figures: a science on itself Advanced functional materials 2012 Journal of Catalysis 2011 Mesoporous zeolites are better catalysts and display enhance uptake in nitrogen adsorption Scaling a powerful tool to highlight trends. N.B. Even if barely significant
3. Artwork in PowerPoint: basics • Why PowerPoint? Availability! • Are there better programs: probably many • Conceptual figures are of essential importance in science • These are the ones people remember! • Reponsibility not to be too ‘suggestive’
3. Artwork in PowerPoint: basics • Before you start: think, google, sketch: ‘brainstorm’ • Customize PowerPoint: • Quick access toolbar • Themes and designs • Get to know Powerpoint: • Alt, ctlr, shift keys • Snap to grid • Zoom: only 400% This is based on a tutorial on the website: www.sciencefarts.com
3. Artwork in PowerPoint: shapes • Shapes is a valuable option: • Union, Substract, Merge, Intersect • Aligning can be troublesome: • The align folder enables to align and distribute easily • Fix the Look aspect ratio: • Prevents your artwork from accidentilly deforming • Standard effects and smart art: • No need to reinvent the wheel explore the options This is based on a tutorial on the website: www.sciencefarts.com
3. Artwork in PowerPoint: shapes • Edit points for trend lines and customized shapes • Use ctrl alt keys • Getting complicated? Use the selection pane to select the right object • Exporting your artwork: • Save as emf, open in paint, resize, and save as JPG
3. Artwork in PowerPoint: example • Dissolution of zeolite crystals occurs in 4 modes: • selective, non-connected • selective, connected • non-selective, • fragmentive 2. 4. 3.
3. Artwork in PowerPoint: example During the lecture I enhance this sketch manually. You can have a try here! Use the tricks of the www.sciencefarts.com tips and tricks • selective, non-connected • selective, connected • non-selective, • fragmentive 1. 2. 3. 4.
4. Modifying pictures in PowerPoint • Contrast, Brightness, and Sharpen • Simple way to enhance pictures • Background removal and set transparent colour • Ideal for making making set ups look more ‘convincing’ • Fill with image: ideal way to give a 3D look
4. Modifying pictures in PowerPoint Making routine pictures looks ´professional´
5. Animations in PowerPoint • Why? • For presentations and, moreover, for fun! • Why Powerpoint?: availability!
5. Animations in PowerPoint • Even more than with figures: think before! • Adjusting size is more difficult • Animation pane • Overview of animations
5. Animations in PowerPoint • Motion paths • Get things moving • Multiple animations, rotation, and timing • Make it realisitic • Smooth start and end • A standard setting
5. Animations in PowerPoint: example Mesoporosity in zeolites leads to a smaller and more active particles 50 % green 50% red 85 % green (active) 15% red (inactive)
5. Animations in PowerPoint: example Mesoporosity in zeolites leads to a smaller and more active particles 50 % green 50% red 85 % green (active) 15% red (inactive) Initial dispersion
5. Animations in PowerPoint: example Mesoporosity in zeolites leads to a smaller and more active particles 50 % green 50% red 85 % green (active) 15% red (inactive) Initial dispersion During Catalysis
6. Examples Covers of scientific journals Some made with powerpoint, others with the help of an artist (Marcel Reich, Switzerland) Check for examples of animations on www.sciencefarts.com
Cover of Chemistry: a European Journal • 2011, PhD -student • Full made in Powerpoint • 3D rotation • Glow • Reflection • Shadows
Cover of Advanced functional materials • 2012, sketched by PhD -student • Drawn and coloured by Marcel Reich • 4 digital enhancements made in PowerPoint: • can you spot them?
Cover of Catalysis Science & technology • 2011, sketched by PhD -student • Drawn and coloured by Marcel Reich • 3 digital enhancements made in PowerPoint: • can you spot them?
Bonus tip: During a presentation: ´w´, ´b´, and ´page# + enter´
Muito obrigado por sua atenção Aproveitem o carnaval!