Download
1 / 64
640 likes | 775 Vues
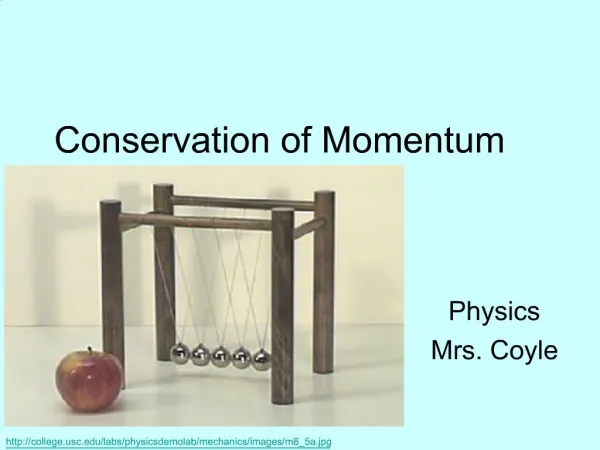
Conservation of utility. There are many type of energy monitoring system in the industry, which measures mainly the Electrical Energy consumed by any machine over period of time. Distribution of energy consumed in a textile mill. Basics of energy.

E N D
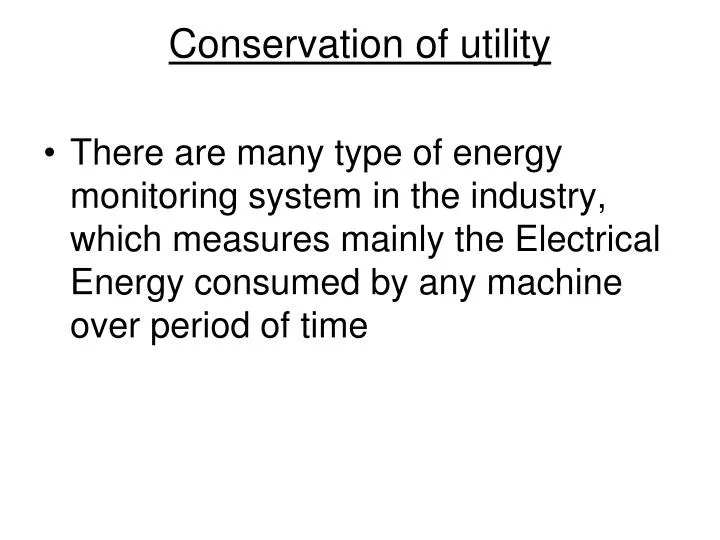
Conservation of utility • There are many type of energy monitoring system in the industry, which measures mainly the Electrical Energy consumed by any machine over period of time
Basics of energy • In any industry the electrical energy is used to achieve some mechanical work. • It is obvious that there will be some difference between the quantity of Input energy and out put work, because some amount of energy will transformed into other form during the process like vibration heat etc. This is called losses.Tease are of two types. • A) Copper loss. b) Excitation loss or Iron loss.
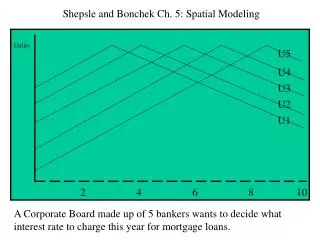
Concept of power saving • “Power saving” is an incomplete terms. • It is like a vector quantity where if you don’t mention the direction ,it will have no use. • Likewise if we don’t mention the comparative out put of the machine against a fixed input, it can’t be used as an index for comparison between similar machine, so unless and until the out put and other parameters are mentioned, saying “savings in power” does not carry any real sense. • So unit consumption per unit of output (in terms of Kg, Meter, CC etc) is the correct expression of energy consumption pattern of any machine.
The energy concept in textile industry • Following methods are mostly used in Textile Industry • Taking the reading of electricity consumed in one day. • Number of machine working on that day • Number of working hour on that day. • Total production in kgs from those machines. • Divide the Total electricity unit by the total production to find out UKG on that particular day.
Limitation of this method • We cant find out who is the main contributor for higher or lower unit consumption/Kg for that day. • There is no information available what is the unit energy consumption for different sort/count run in that day. • We don’t know the comparative consumption of all the machines running with same material and with identical parameters. • There is huge time gap between the time when machine actually consumes and the time when the data is analyzed. • It is a post mortem type of procedure.
Conventional measuring technology • When the automation was started in the Textile Industry, the machine speed was also started increasing and both manufacturer and user felt the necessity of measuring the output , speed stoppage of the machine in automatic manner. To fulfill that needs of the industry, machinery manufacturer came out with few new features on their machines.
Phase-1 • Introduction of digital counter meter for getting the production reading instead of mechanical counter meter. • Introduction of digital display for eletrically measured machine speed, Stop time • Display of calculated efficiency based on the running time. • Display of the air pressure in BAR/PSI in pneumatically controlled machines.
Phase-2 • Introduction of SSM (Ring data) to monitor the Speed of the machine, Breaks, Rouge Spindle, Production in Hank and finally the efficiency. • Introduction of Auto leveler in high speed Drawing and Carding. • Lastly the DSP Auto leveler for Super high speed drawing machine.
Contd…. • In all these above steps nowhere the importance was given on the resolution of the measurement for the accuracy and reliability of the data except DSP technology. • Production ,speed and stoppage measurement is done based on the Induction sensor or proximity sensor which has a resolution of either 360 degree or 180 Degree.i.e 1 or 2 pulse/rotation. • There is no such data or tool introduced by any of the machine manufacturer by which we can asses the • a) performance of Individual machine in terms of Energy consumption
Contd….. • b) In terms of mechanical/electrical failure. • c) In terms of the maintenance work done and replacement of any consumable parts in the machine. And lastly • d) There is no scientific tool available for asessing the performance of the maintenance people and their schedule work.
Scientific tool and report • Nowadays In every stages of manufacturing , the necessicity of Scientifically correct data, analytical tool is being realised by the industry because of High Speed of the machine, less man power involvement, higher energy cost involved in the process.
New concept of using Energy data • In todays era of technology it is possible to measure the production of any machine at very high resolution using optical scanner and DSP technology. This eliminates the resolution errors of induction based production sensor. • It is possible to measure the electrical energy consumed by the machine at Nano seconds intervel by using high resolution nano processor and Sine Wave scanner (AdvancedCT).
Contd….. • All the above measures are possible in online also so that one can get the real time energy data continuously. • This online real time energy data helps us in many ways.
Use of energy data • It can be used as a tool to asses any maintenance work done in the machine like, Change of bearing, oils change, gear change etc . • It can be used to asses the life of any consumable items used frequently in a machine. • It can be used to asses the use of Compressed Air in any area where Pneumatics are used. • It can be utilised to know the unit consumption per unit production of any machine with high accuracy level(within 0.01%).
Online energy data can be interpreted in a continuous graphical from correlating with UKG,KWH, SPEED,DOFFTIME etc • This graphical form helps the people to compare any number of machine running with identical parameters at any instant. This is the actual use of Technolgy for saving the cost of production by optimising the following
Speed of the machine • The life of consumable items like Ring, Ring Traveller, • Optimising the frequency of Maintenance shedule work thereby reducing machine detention Hrs, consumption of spares, improving the machine life. • Find out the bench mark machine of any factory and continuous scope of improvement to reduce the unit cost of production.
Some case study • We will see few real time data and graphs after installation of an online energy monitoring system in a textile spinning unit.
Doff duration loss a new way to save time loss Actually Duration loss is very high than doffer loss
Score board RINGFRAME
control not existing or not working it is noted that only two steps and occurs at very quick fashion It is no way suitable for 60 nec. control not existing or not working it is noted that only two steps and occurs at very quick fashion It is no way suitable for 60 nec.
No speed change over , production loss 4%, time loss 3% per doff
Harmonics effect Improper speed control functions Harmonics effect Improper speed control functions
Very high UKG Have to study this in deep major problem No speed control working
Suspects improper piecing level or May many spindles breakages or improper ohtc running
Once again improper Speed control run results production, and time loss
Once again improper Speed control run results production, and time loss
Speed control is too slow loss of 8% time and 6% production Mechanical inspection needed
Surprise to see this , indication of very Abnormal working conditions
Machine to machine variable speed patterns different losses different performance less 10% doff time
Comparison between twotypes of machine High end breakes
G5/1 LR6 Reduced power consumption by improvised speed control Power higher by 10%