Download
1 / 6
60 likes | 65 Vues
This data provides rankings of states based on various labor market metrics such as unemployment rates, employment change, labor force participation, and more. It includes information from the U.S. Department of Labor and Bureau of Labor Statistics.

E N D
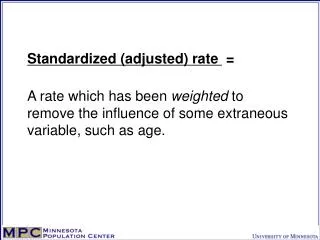
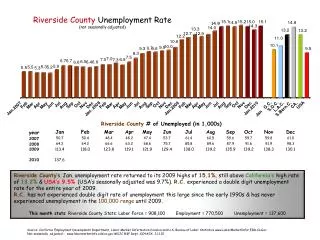
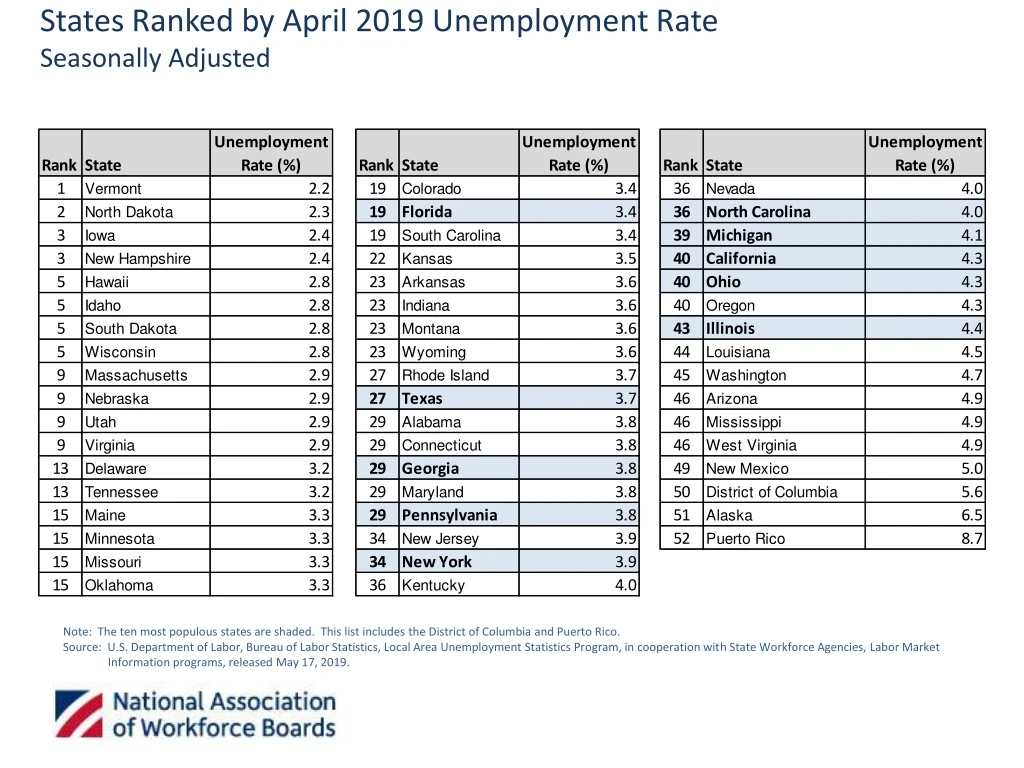
States Ranked by April 2019 Unemployment Rate Seasonally Adjusted Note: The ten most populous states are shaded. This list includes the District of Columbia and Puerto Rico. Source: U.S. Department of Labor, Bureau of Labor Statistics, Local Area Unemployment Statistics Program, in cooperation with State Workforce Agencies, Labor Market Information programs, released May 17, 2019.
States Ranked by Annual Nonagricultural Employment Change April 2019, Seasonally Adjusted Note: The ten most populous states are shaded. This list includes the District of Columbia, Puerto Rico, and the Virgin Islands. Source: U.S. Department of Labor, Bureau of Labor Statistics, Current Employment Statistics Program, in cooperation with State Workforce Agencies, Labor Market Information programs, released May 17, 2019.
States Ranked by Annual Nonagricultural Employment Percentage Change April 2019, Seasonally Adjusted Note: The ten most populous states are shaded. This list includes the District of Columbia, Puerto Rico, and the Virgin Islands. Source: U.S. Department of Labor, Bureau of Labor Statistics, Current Employment Statistics Program, in cooperation with State Workforce Agencies, Labor Market Information programs, released May 17, 2019.
States Ranked by Labor Force Participation Rate April 2019, Seasonally Adjusted • The labor force participation rate represents the proportion of the civilian noninstitutional population that is in the labor force. Note: The ten most populous states are shaded. This list includes the District of Columbia. Source: U.S. Department of Labor, Bureau of Labor Statistics, Local Area Unemployment Statistics Program, in cooperation with State Workforce Agencies, Labor Market Information programs, released May 17, 2019.
States Ranked by Employment to Population Ratio April 2019, Seasonally Adjusted • The employment to population ratio represents the proportion of the civilian noninstitutional population that is employed. Note: The ten most populous states are shaded. This list includes the District of Columbia. Source: U.S. Department of Labor, Bureau of Labor Statistics, Local Area Unemployment Statistics Program, in cooperation with State Workforce Agencies, Labor Market Information programs, released May 17, 2019.
Florida Department of Economic Opportunity,Bureau of Labor Market Statistics Products and Services that Support Economic Development Labor supply studies for business recruitment Labor cost analysis for business site selection Skills-matching analysis for reemployment Economic impact analysis for job creation / return on investment GIS maps for business recruitment / economic development Vacancy / hiring needs surveys for reemployment Targeted occupations for reemployment Targeted industry profiles for job creation Employer listings for business recruitment Competitive analysis for prison industry staffing Competitive analysis for federal rural business loans Targeted Employment Areas (TEAs) for foreign investor program Labor shed and Census commuting patterns for job creation Area job market profiles