Download
1 / 23
240 likes | 266 Vues
Learn two techniques to visualize paired comparisons easily using logical tables and letter-based representations. Explore the multcompView package in R for effective visual summaries of comparisons.

E N D
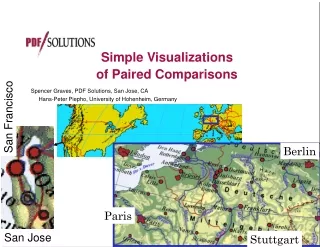
Simple Visualizations of Paired Comparisons San Francisco Spencer Graves, PDF Solutions, San Jose, CA Hans-Peter Piepho, University of Hohenheim, Germany Berlin Paris San Jose Stuttgart
Two Methods • Convert a table of logicals (TRUE or FALSE) indicating which pairs of k objects are / are not distinct • p-value or distance exceeding a threshold (or correlation less than a threshold) • Into an easily decoded visual • Two alternatives • Letter-based representation (Piepho 2004, JCGS 13: 456-466) • “Neighbor” or “Indistinct Ts” (similar to “undifferentiated classes”; Donague 2004) • R Package “multcompView” (www.r-project.org) * John R. Donaghue (2004) “Implementing Shaffer’s multiple comparison procedure for a large number of groups”, pp. 1-23 in Benjamini, Bretz and Sarkar (eds) Recent Developments in Multiple Comparison Procedures (Institute of Mathematical Statistics Lecture Notes-Monograph Series vol. 47)
as Rectangles & Triangles as Ts multcompTs Post-surgery recovery time (min.) with different heating blankets (b1, b2, b3) vs. a standard blanket (b0). • Each “level of a factor” (boxplot) • is associated with a column of the display which indicates whether each other level is or is not distinct • Example: • b0 is distinct from b2 but not b1 or b3 • b3 has the same “undifferentiated pattern” as b0 • Each “T” or triangle points to the level(s) that column represents library(multcomp) (minutes~blanket, recovery)
a b ab a Ts Letters “Letters” displayed as rectangles multcompLetters • Rows that share “Letters” are NOT distinct • Example: • b1 is not distinct from any of the other levels, because • it shares “a” with b0 and b3, and • it shares “b” with b2 • b0 is not distinct from b1 or b3 but is from b2
a b ab a Ts Letters “Letters” displayed as rectangles b3 b2 b1 b0 recovery: minutes ~ blanket • dataPOWER matches Piepho’s Letters (and JMP) in this case b0 b1 b2 b3
a b ab a Ts vs. Letters
Cholesterol Study • 5 different treatments • 1time = 20 mg once/day • 2times=10 mg twice/day • 4times = 5mg 4 times/day • drugD, drugE = 2 other drugs • drugE produced the greatest reduction, and is the only treatment distinct from all others • For “2times” and “4times”, we must read 2 different “letters” but only one “T” each. Reduction in Cholesterol See the “multcomp” package in R or Peter H. Westfall, Randall D. Tobias, Dror Rom, Russell D. Wolfinger, and Yosef Hochberg (1999) Multiple Comparisons and Multiple Tests (SAS Institute)
cholesterol: response ~ trt in dataPOWER • dataPOWER matches Piepho’s Letters (and JMP) in this case 1time 2times 3times 4times drugD drugE
R Foundation for Statistical Computing • www.r-project.org • R is the platform of choice for an increasing number of the leading experts in statistical computing • 723 contributed packages downloadable from ‘CRAN’ (2006.04.30) • 58 mirrors in 24 countries (2006.04.30) • The availability of downloadable R code substantially reduces the time to learn, apply, modify and extend existing statistical techniques. • You can increase your chances that people like me will read and cite your work if you publish • in journals with articles, data and R scripts freely downloadable or • books with companion R packages
a b ab a multcompTs multcompTs multcompLetters multcompLetters multcompBoxplot Plot Print Data multcompView package in R Paired Comparison Summary function object of class
Summary: R package “multcompView” • Two visual summaries of paired comparisons relative to a threshold: • multcompTs: Easily decoded visual • multcompLetters: Parsimonious, letter-based summary that does not require graphics • multcompBoxplots: General function for producing variations of either or both with boxplots.
anorexia: postwd ~ Treat FT Cont. CBT • dataPOWER matches Piepho’s Letters (and JMP) in this case CBT Cont. FT
warpbreaks: breaks ~ tension H M L • dataPOWER matches Piepho’s Letters (and JMP) in this case H L M
Number of defects of a certain type • Defects = counts range from 0 to 170 • Normal plot on a log scale after Defects==0 were replaced by 0.1. • 0.1 chosen to place Defects=0 roughly on the line on a normal probability plot • We use multcompBoxplot, ignoring the obvious violations of assumptions involved in applying a normal-theory ANOVA to log(counts) • Before we used the results, we’d want to repeat the analysis using more software for generalized linear mixed models more appropriate to these data.
log(Defects) ~ operator • 24 operators • From the “Ts”, it appears that 2 are better than 6 others • o1 and o5 are better than • o15, o10, o2, o17, o6, and o14 • Moreover 2 operators seem WORSE than all others: o6 and o14
log(Defects) ~ operator • From the Letters: • It’s clear that o6 and o14 are worse than all the others • It’s NOT obvious that o2 and o5 are the only operators significantly better than 6 others. • Conclusion: • Letters are more concise: 5 columns vs. 9 in this example • Ts are easier to read.
log(Defects) ~ operator • The same display as boxes (and triangles for the bases of Ts) • Same information • More easily read: It seems easier to see that o15 is different from o1 and o5
log(Defects) ~ operator (dP sort) • dataPOWER does not match: o02 and o08 • are NOT different according to Ts & Letters • IS different per dataPOWER • o02 and o08 • do NOT both have boxes in the same column per dataPOWER • but DO in “Letters”
log(Defects) ~ operator • dataPOWER does not match: o02 and o08 • are NOT different according to Ts & Letters • IS different per dataPOWER • Same for o08 with o05, o07, o15, o16, o21, o22, and o23. • JMP matches Piepho’s Letters (and NOT dP)
Same example in JMP • Conclusion: JMP matches dP • the “operator” codes are not the same, because I changed the codes & didn’t regenerate the analysis.
What next? • Short term: • Ignore the discrepancy in the display in the more complicated example • Fix the documentation so someone can make sense of it. • Intermediate term: Fix the dP TukeyHDS code • Long term: • Fix the Tukey display to match Piepho’s letters • Some customers know how to read those things, so we shouldn’t just change it. • Even longer term: • Consider adding the “Ts” in some version • It may be easier to read, but customers want other things more than this.