Download
1 / 4
40 likes | 93 Vues
BY RLKox 0 2 4 6 0 2 4 6 (d). A. 0 12 24 36 ( h ). CaRLK1. NtGLB1. CaAct. CaRLK1. B.

E N D
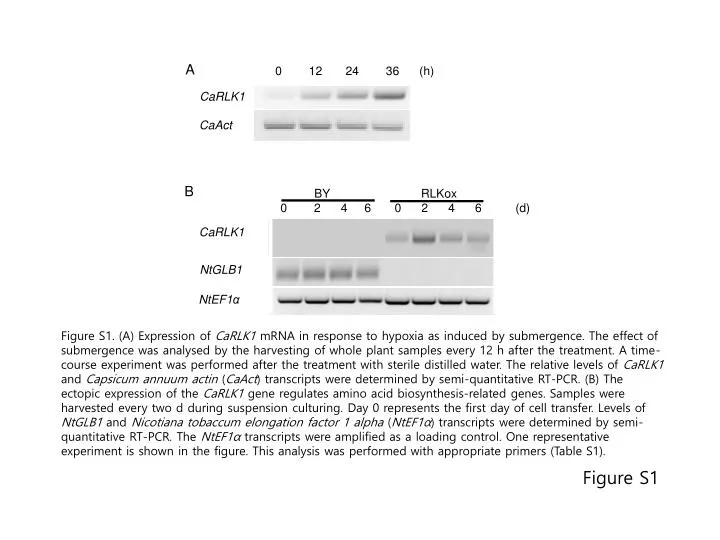
BY RLKox 0 2 4 6 0 2 4 6 (d) A 0 12 24 36 (h) CaRLK1 NtGLB1 CaAct CaRLK1 B Figure S1. (A) Expression of CaRLK1 mRNA in response to hypoxia as induced by submergence. The effect of submergence was analysed by the harvesting of whole plant samples every 12 h after the treatment. A time-course experiment was performed after the treatment with sterile distilled water. The relative levels of CaRLK1 and Capsicum annuum actin (CaAct) transcripts were determined by semi-quantitative RT-PCR. (B) The ectopic expression of the CaRLK1 gene regulates amino acid biosynthesis-related genes. Samples were harvested every two d during suspension culturing. Day 0 represents the first day of cell transfer. Levels of NtGLB1 and Nicotiana tobaccum elongation factor 1 alpha (NtEF1α) transcripts were determined by semi-quantitative RT-PCR. The NtEF1α transcripts were amplified as a loading control. One representative experiment is shown in the figure. This analysis was performed with appropriate primers (Table S1). NtEF1α Figure S1
B A Dissolved Oxygen (mg·L-1) Figure S2. (A) Quantification of free amino acids. Each composition was determined using Hitachi’s Amino Acid Analyzer. Error bars represent the standard deviation from the mean (n = 2). (B) Validation of the hypoxic conditions that were induced by the suspension cell culture (A). Dissolved oxygen concentrations in liquid culture medium were analysed after 7 d of culturing. Error bars represent the standard error from the mean (n = 3). The differences between the three conditions are significant at P<0.05. AA (μmol·g-1 DW) Figure S2
B A 95 43 Figure S3. (A) NtRBOHD protein levels were increased in the RLKox cells. The proteins were extracted, resolved by SDS-PAGE, and analysed by western blot with the anti-NtRBOHD antibody, which was directed against 2 peptides of the NtRBOHD protein, as described in Simon-Plas et al. (2002). A total of 25 μg of protein was loaded. A protein band (43 KDa) that was used as a loading control was detected non-specifically. The molecular mass markers that are indicated on the right sides denote the molecular masses in kDa. (B) Detection of hydrogen peroxide by DAB staining in N. tabacum-originated cells. Red bar indicates length. 200 μm NtRBOHD BY RLKox 43 KDa Figure S3 BY RLKox
WT RLKox 3 Figure S4. Recovery phenotype of wild-type N. benthamiana and transgenic plants. Four-week-old seedlings were flooded for 8 d and photographed on d 25 after the termination of the flood treatment. Figure S4