Download
1 / 25
260 likes | 461 Vues
HUMANITARIAN DASHBOARD. COORDINATED ASSESSMENT APPROACH PHASE III. What Are We Aiming For. Increase the evidence base for humanitarian strategies and appeals Improve monitoring to the point it can inform coordination, decision making and humanitarian funding. Key Actions.

E N D
HUMANITARIAN DASHBOARD COORDINATED ASSESSMENT APPROACH PHASE III
What Are We Aiming For Increase the evidence base for humanitarian strategies and appeals Improve monitoring to the point it can inform coordination, decision making and humanitarian funding
Key Actions Review systematically secondary information and identify information gaps Identify and measure an agreed set of indicators (tip: start with 2 or 3 indicators only) Ensure geographical and temporal synchronisation of assessments Establish a process for collating data from multiple assessments Establish a process for conducting a shared analysis of data
Methods and Tools Common Operational Data Set Survey of surveys Humanitarian Dashboard
What Is the Humanitarian Dashboard A platform to systematically consolidate data from cluster leads and other sources (primary and secondary data) A process to facilitate cross-sectoral analysis and a shared understanding of the humanitarian situation. A tool to highlight information gaps and monitor CAP/programme cycles (against indicators and humanitarian caseloads) This leads to an output called (for now) Humanitarian Dashboard Important: All this is owned by the IASC. OCHA’s role is to facilitate this process
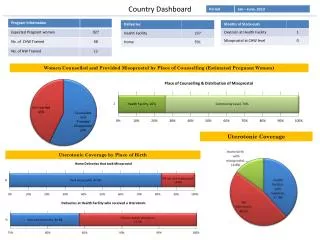
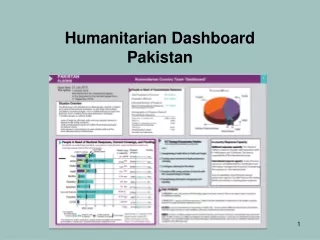
Platform Components Inter-sectoral Analysis • (overview/cover pages) • Comprehensive overview (outlook, most affected groups and regions, main drivers). • Key figures • Priority needs (as defined by HCT) • Chart: Needs, target and coverage • Response overview (against commitment/ targets) • Analysis: Gaps and trends • Reference indicators (baseline) • Operational Constraints Sectoral analyses • (dashboard matrix) • Data collection form (Excel) • Sectoral analysis completed by each cluster lead: • Quantitative information: caseloads, planning figures, coverage (vs. reached), indicators • Qualitative information: Priority needs, analysis (affected groups, priority areas, trend, , risks, gaps, challenges), information gaps, assessment planning • Visualisation components: cross-sectral needs/coverage chart, trend chart, baseline analysis, historic trend chart. • Somalia: Component of the Single Reporting Format
PRIORITY NEEDS Highlight any changes in needs since the CAP 2012 document (E.g. higher rates of malnutrition among people in famine affected regions) SECTOR ANALYSIS Elaborate on the points listed on the left and highlight changes since the CAP 2012 document - most affected groups, - most affected areas, - trend (of needs), - main challenges (of - risks, - gaps (related to caseloads and indicators). 1. Analysis
Process ANALYTICAL FRAMEWORK FTS OPS INTER-SECTORAL LEVEL: DATA GATHERING (from clusters/sectors) ANALYSIS by ICCM CONSOLIDATION OUTPUT COMMON REQUEST FORM Inter-sectoral analysis and clearance of draft by HCT/ICCM (in other words: a discussion based on the information consolidated through sectoral sheets and the inter-sectoral template ) CODs / FODs (humanitarian profile) Other sources Product creation (Sequencing and alignment with other OCHA outputs and product SECTORAL ANALYSIS by cluster leads 3W SECTORAL CONSOLIDATION AND DATA VETTING Needs assments (Assessment registry) SECTORAL LEVEL: • SECTORAL DATA COLLECTION • PRIMARY DATA (sectoral assessments) • REVIEW OF SECONDARY DATA • MONITORING Systems
STAKEHOLDERS DATA COLLECTION OUTPUT CONSOLIDATION ANALYSIS HC OCHA (HAO, IMO, IPO) OCHA (IMO) HCT HC OCHA (HoO, HAO, IMO) • CLUSTERS • OCHA (HAO, IMO) • UNDAC (in certain cases) • Other (Governments, online communities, crowd sourcing) IMPLEMENTATION CAP CYCLE 2012 Dashboard Updates CAP 2013 Documents CAP 2012 Documents Dashboard Updates MYR Cross-sectoral overview pages developed for: Afg CDI Niger CAR DRC Djibouti CHAD Haiti Liberia oPT Somalia Yemen Philipinnes Zimbabwe Kenya S-Sudan Sudan Ideally 3 updates to inform midyear review (3 data points allow for better trend analysis and illustration) Dashboard updates should inform midyear review (continuious monitoring of situation, indicators, progress towards objectives) To monitor progress since MYR Dashboard updates should inform development of CAP 2013 Documents
What Does That Mean for Our Colleagues in the Field? Cluster Leads are requested to update their sectoral analysis of the needs, response and operational priorities. Cluster leads should: Conduct a review of secondary information and identify information gaps Promote consistency among Cluster Members in the collection, sharing and reporting of data, as well as on terminology usage (affected, reached, covered – see below) Log the cluster objectives and indicators from the CAP in to the Dashboard Matrix and highlight any changes that have occurred since the beginning of the CAP cycle Log caseloads and number of people covered (per main activity, e.g. provision of sustainable water), highlighting any changes that have occurred since the beginning of the CAP cycle Facilitate an analysis of needs and the response, based on this data. Cluster Leads are encouraged to reserve 15 minutes at Cluster meetings to review/update their sectoral analysis with their members Submit agreed sectoral analysis to OCHA by the agreed cut-off date
Maintenance of the Inter-Sectoral Overview • Maintenance of the Inter-Sectoral Overview (OCHA and ICCT) • The Inter-Cluster coordinator will work regularly with Cluster coordinators to review the sectoral needs, response and gaps/operational priorities: • OCHA will coordinate the process for maintaining the Dashboard • OCHA will support the ICCT in undertaking the routine analysis of the data in the Dashboard • OCHA will submit the completed and vetted Dashboard to the HCT • OCHA will publish the Dashboard, on behalf of the HC
Consistent Terminology Affected people include all people impacted by the crisis in one way or the other. Not all affected people are in need of humanitarian assistance. People in need (caseload) is a sub-group of the affected people. They require humanitarian assistance in one form or the other. People targeted (beneficiaries) includes all people that the cluster system is trying to assist. This will most likely be a sub-group of the people in need taking into consideration that many are being assisted by actors not-participating in the cluster system. People reached include those that have received some form of assistance from a cluster member. This figure says nothing about how long and how well the assistance is helping the beneficiary. People coveredis a more meaningful figure as it takes into consideration a standard (e.g. Sphere). There is a significant difference between following two statements: 1000 people received water (people reached), or, 1000 people received enough water to cover their needs (15 litres per day) for the next two weeks.
XI. Conclusions Facilitates dialogue: Situational analysis based on systematically collected data Promotes a common understanding and analysis of the humanitarian situation Monitors progress: Supports the HCT and Clusters in monitoring appeal Assists Clusters in presenting consolidated information relative to their sector Strategic decision-making: Informs Humanitarian Country Team discussions Identifies conflicting data and information gaps Supports advocacy by illustrating key figures and issues Minimal common denominator: Basis to compare across emergencies by focusing on caseloads and their coverage
In the Case of Somalia… Dashboard process helps to develop a shared understanding of the humanitarian situation and get the figures right Informs data-derived products (maps, briefs, TPs) Helps streamline information requests (single reporting format) and creating a certain predictability in the information OCHA is requesting Has become a helpful tool and basis for analysis (baseline analysis, trend analysis, coverage, funding against coverage)
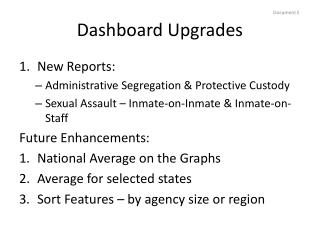
Next Steps… Roll-out of dashboard process in all CAP countries Alignment with MIRA (multi-cluster rapid assessment) to form a suite of NATF tools and solutions Streamlining OCHA’s information requests (and management) Integration with relevant information streams (OPS, FTS) Develop online platform Making the dashboard an analytical tool (develop a framework to assist analysis similar to the MIRA)