Download
1 / 23
230 likes | 238 Vues
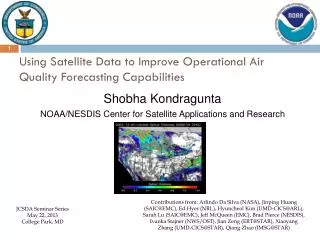
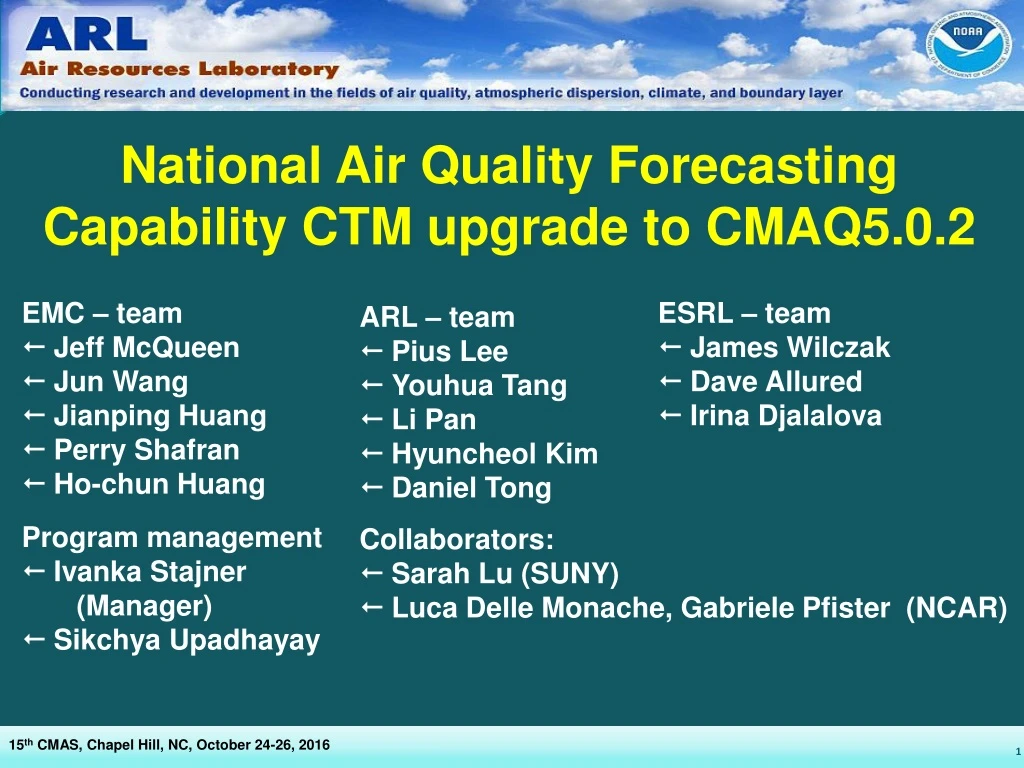
National Air Quality Forecasting Capability CTM upgrade to CMAQ5.0.2. EMC – team Jeff McQueen Jun Wang Jianping Huang Perry Shafran Ho- chun Huang. ESRL – team James Wilczak Dave Allured Irina Djalalova. ARL – team Pius Lee Youhua Tang Li Pan Hyuncheol Kim Daniel Tong.

E N D
National Air Quality Forecasting Capability CTM upgrade to CMAQ5.0.2 • EMC – team • Jeff McQueen • Jun Wang • Jianping Huang • Perry Shafran • Ho-chun Huang • ESRL – team • James Wilczak • Dave Allured • Irina Djalalova • ARL – team • Pius Lee • Youhua Tang • Li Pan • Hyuncheol Kim • Daniel Tong • Program management • IvankaStajner • (Manager) • SikchyaUpadhayay • Collaborators: • Sarah Lu (SUNY) • Luca DelleMonache, Gabriele Pfister (NCAR) 15th CMAS, Chapel Hill, NC, October 24-26, 2016
Implementing NOAA/NWS National Air Quality (AQ) Forecast Capability operationally to provide graphical and numerical guidance, as hourly gridded pollutant concentrations, to help prevent loss of life and adverse health impacts from exposure to poor AQ. Exposure to fine particulate matter and ozone pollution leads to premature deaths, of over 50,000 annually in the US (Science, 2005; recently updated to 100,000 deaths; Fann, 2011, Risk Analysis). Direct impact on reducing loss of life: AQ forecasts have been shown to reduce hospital admissions due to poor air quality (Neidell, 2009, J. of Human Resources ) Impact and Partnerships • NOAA’s AQ forecasting leverages partnerships with EPA, under authorization of 15 USC 313, and complies with Congressional direction to NWS for building and implementing operational AQ forecasting. Highlights of recent feedback from state and local AQ forecasters: AQ forecasters rely on NAQFC products to issue AQ forecasts, NAQFC ozone predictions have improved substantially this year relative to previous years over large areas of Eastern US, AQ forecasters urged NOAA to continue producing ozone predictions and prototype particulate matter predictions. NOAA develop & evaluate models; provide operational AQ predictions EPA maintain national emissions, monitoring data; disseminate/interpret AQ forecasts State and local agencies provide emissions, monitoring data, AQI forecasts 2 15th CMAS, Chapel Hill, NC, October 24-26, 2016
Operational NAQFC • Chemical Transport Model: • CMAQ4.6 for CONUS, AK & HI • CB05 gas chemistry • Aero4 aerosol chemistry • LBC: monthly varying GEOS-CHEM • Dynamic LBC for dust • derived from NGAC • O3 product dissemination: TOC 2016: O3 & PM2.5 (CONUS) Lee, McQueen, Stajner et al., Weather & Forecasting 2016 DOI: WAF-D-15-0163.1 Max Daily 8h (MDA8) O3 threshold 70ppb 24 h averaged PM2.5 threshold 35 μg/m3 Basic metric: Bias, RMSE, and % Hit Rate 2010: O3(AK) 2010: O3 (HI) Strong interest for NOAA PM2.5 forecast. E.g., Fann et al., Risk Analysis 2011: “Studies by American Cancer Society and National Mortality & Morbidity Air Pollution Study showed that 130,000 and 4,700 died of PM2.5 and O3; respectively in 2005”. 15th CMAS, Chapel Hill, NC, October 24-26, 2016
Emission Data Sources for CMAQ 5.0.2 • Area Sources • US EPA 2011 NEIs; • Canada 2006 Emission Inventories (in NEI2011 package); • Mexico 2012 EI for six border states (in NEI2011 package); • New US residential wood combustion and oil and gas sectors; • Snow/Ice effect on fugitive dust emissions; • Mobile Sources (onroad) • NEI 2005 projected to 2011 using Cross-State Air Pollution Rule (CSAPR) projection for US sources and then adjusted further to the forecast year using trends from surface and satellite observations from 2011 to 2014; • Canada 2006 Emission Inventories; • Mexico 2012 EIs; • Point Sources (EGUs and non-EGUs) • Baseline emissions from NEI2011; • US EGU sources updated with 2014 Continuous Emission Monitoring (CEM); • Projected into forecast year using DOE Annual Energy Outlook projection factors; • Natural Sources • Terrestrial biogenic emission: BEIS model v3.14; • Sea-salt emission: CMAQ online Sea-salt emission model based on 10m wind; • Fire emissions based on HMS fire detection and BlueSky emission model; • Windblown dust emission: FENGSHA model;
LBC: e.g., Sahara Dust Intrusion Sahara dust event May 9-11 2015 VIIRS AOD Courtesy: Shobha Kondragunta (NESDIS) 12 UTC May 9 12 UTC May 10 12 UTC May 11 15th CMAS, Chapel Hill, NC, October 24-26, 2016
Surface concentration of PM2.5 at 10 UTC May 11 2015: modeled (background shading), measured (filled circle) Without dynamic boundary condition With dynamic boundary condition PM2.5 in µg m-3
Analysis of the June 9-12 2015 Canadian fire:Surface PM2.5 with frontal passages 15th CMAS, Chapel Hill, NC, October 24-26, 2016
Analysis of the June 9-12 2015 Canadian fire (cont’d)Surface PM2.5 with frontal passages NAGC Base Difference 15th CMAS, Chapel Hill, NC, October 24-26, 2016
Analysis of the June 9-12 2015 Canadian fire (cont’d)Surface PM2.5 with frontal passages 15th CMAS, Chapel Hill, NC, October 24-26, 2016
Analysis of the June 9-12 2015 Canadian fire (cont’d)Surface PM2.5 with frontal passages Showed improved skills and awaits NGAC upgrades 15th CMAS, Chapel Hill, NC, October 24-26, 2016
MOVES2014a has similar O3 precursor rate (g/mile) as MOVES2014 Helps PM2.5 but exacerbate O3 over-prediction Pie chart shows % of PM2.5 emission Courtesy: Jin-Sheng Lin et al., VDEQ, 2016 15th CMAS, Chapel Hill, NC, October 24-26, 2016
complex terrain e.g., South Coast poses challenge MDA8 O3 on June2 2016 24 h avg PM2.5 on June2 2016 Courtesy A. Sleinkofer et al. EMC internship 15th CMAS, Chapel Hill, NC, October 24-26, 2016
Performance comparison between Prod & CMAQ5.0.2 Bias for MDA8 O3 8/01-9/15/2016: Prod; CMAQ5.0.2 12Z 1/day; bias correct CONUS 15th CMAS, Chapel Hill, NC, October 24-26, 2016
Performance comparison between Prod & CMAQ5.0.2 cont’d Bias for hourly PM2.5 8/01-9/15/16: Prod; CMAQ5.0.2 12Z 1/day; bias correct CONUS 15th CMAS, Chapel Hill, NC, October 24-26, 2016
Performance comparison between Prod & CMAQ5.0.2 cont’d Bias for hourly PM2.5 8/01-9/15/16: Prod; CMAQ5.0.2 12Z 1/day; bias correct NE SE 15th CMAS, Chapel Hill, NC, October 24-26, 2016
Performance comparison between Prod & CMAQ5.0.2 cont’d Bias for hourly PM2.5 8/01-9/15/16: Prod; CMAQ5.0.2 12Z 1/day; bias correct UM LM 15th CMAS, Chapel Hill, NC, October 24-26, 2016
Performance comparison between Prod & CMAQ5.0.2 con’d cont’d Bias for hourly PM2.5 8/01-9/15/16: Prod; CMAQ5.0.2 12Z 1/day; bias correct SW coast NW coast 15th CMAS, Chapel Hill, NC, October 24-26, 2016
Evaluation Metrics: e.g., Willmott et al., 2011 I.J. Climatology doi:10.1002/joc.2419 15th CMAS, Chapel Hill, NC, October 24-26, 2016
MDA8 O3 (ppb) performance metrics between Prod and CMAQ5.0.2 Aug 1-Sep 5 2016 15th CMAS, Chapel Hill, NC, October 24-26, 2016
24h avg PM2.5 (μg m-3) performance between Prod and CMAQ5.0.2 Aug 1-Sep 5 2016 Ozone ppb 15th CMAS, Chapel Hill, NC, October 24-26, 2016
Future Directions Chemical Analysis: homogeneously generated fields over multiple years NAQFC in finer resolutions: Chemically, spatially and temporally Incorporation of air-surface exchange processes in air chemistry Air chemistry as one of NCEP Earth Modeling System Framework components example example example ARL Science Review, June 21-23, 2016
Summary • Anticipated FY17 implementation of CMAQ5.0.2 • Improves O3 forecasting skill • Reduced RMSE improved spatial & temporal accuracy • This improvement is attributable to NAM and chemistry in CMAQ5.0.2 • & the use of the most updated trend to modulate mobile NOx • Improve PM2.5 forecasting skill, esp. during the wildfire season • Reduced under-estimation of PM2.5 in the initialization fields by • including a 24 h analysis assisted initialization adjustment • New BlueSky improves fuel and consumption models • The NGAC-provided dust boundary condition • Fugitive dust -- crustal elements, are explicit in cmaq5.0.2 15th CMAS, Chapel Hill, NC, October 24-26, 2016
Challenges remains beyond FY17: • Finer resolution • Evaluation metrics for fine resolution output • Complex terrains • Coastal region over-estimation of O3 • CMAQ I/O operation bottle-neck • Test and improve NGAC-Smoke derived dynamic BC • Irregularity of oil and gas emission inventory • Mobile emission sources modeled by MOVES2014a 15th CMAS, Chapel Hill, NC, October 24-26, 2016