Download
1 / 31
310 likes | 425 Vues
Aspects of a climate observing system: energy and water. Kevin E Trenberth NCAR. Tracking Earth’s Global Energy Where has global warming from increased GHGs gone?. Kevin E Trenberth NCAR. Where did the heat go?. 2008 is the coolest year since 2000 Carbon dioxide continues to rise

E N D
Aspects of a climate observing system: energy and water Kevin E Trenberth NCAR
Tracking Earth’s Global EnergyWhere has global warming from increased GHGs gone? Kevin E Trenberth NCAR
Where did the heat go? • 2008 is the coolest year since 2000 • Carbon dioxide continues to rise • Radiative forcing continues apace • Where did global warming go?
Global temperatures and carbon dioxide through 2008 Base period 1961-90
Global Temperature anomalies Trend 1998 to 2008 is slightly positive but not significant. Hadley Centre and CRU
Natural variability • We glibly answer that natural variability is the cause of the cooler year • After-all we did have a La Niña in 2007-2008 • But where did the energy go? • We should be able to trace it!
Nino 4 Nino 3.4 Nino 1+2 • El Niño conditions • (NINO 3.4 > 0.5oC) since June, are expected to last through the Northern Hemisphere Winter • All NINO indices increased in July 09. Nino region indices, as area-averaged monthly SST anomalies (oC) asdepartures from 1971-2000 Climate Prediction Center Evolution of Pacific NINO SST Indices Nino 3 Strong La Niña 2007-08 Returns weakly in 2008-09 Jan 2008 coldest month on land for long time El Niño after June 2009
Cooling can easily happen for a decade or so Global Annual Surface Air Temperature, MPI-ECHAM CGCM: A2 Forcing Easterling et al 2009 GRL
2000-2005 (CERES Period) Trenberth et al 2009
A warming climate has a cause: Radiative Forcing and Response of Climate ForcingsW m-2 CO2: 1.6 GHGs: 3.0 Aerosols: -1.4 Net: 1.6 Feedbacks +Water vapor 2.1 +Ice-albedo -Radiation -2.8 Net 0.9
Where does energy go? • Warms land and atmosphere • Heat storage in the ocean (sea level) • Melts land ice (sea level) • Melts sea ice and warms melted water • Evaporates moisture cloud reflection = lost to space Can we track it?
Energy content change 1022 J Oceans >90% 1961-2003 (Blue bars) Figure 5.4 IPCC AR4 1993-2003 (Burgundy bars)
Matching ocean heat storage (Willis et al 04) and TOA radiation (Wong et al 06)
Sea level is rising: from ocean expansion and melting glaciers • Since 1992 • Global sea level • has risen 48 mm • (1.9 inches) • To 2003: • 60% from • expansion as ocean temperatures rise, • 40% from melting glaciers • Courtesy Steve Nerem • U Colo
Revised ocean heat content 0.8 W m-2 0.3 W m-2 Levitus et al 2009 Yearly time series of ocean heat content (1022 J) for the 0-700 m layer from Levitus et al (2009), Domingues et al.(2008) and Ishii and Kimoto (2009) with a base period of 1957-1990. Linear trends for each series for 1969-2007 given in the upper portion of the figure.
What about 2003 to 2008? 2003 2008
Solar irradiance Drop of about 0.5 W m-2 or 0.1 W m-2 for radiative forcing Total Irradiance Monitor (TIM) on the Solar Radiation and Climate Experiment (SORCE), U Colorado
Snow cover and Arctic sea ice are decreasing Arctic sea ice area decreased by 2.7% per decade (Summer: -7.4%/decade) up to: 2007: 22% (106 km2) lower than 2005 2008, second lowest • To melt 106 km2 ice 1 m thick (2007) to 10°C = 3.4x10²⁰ J • Globally per year since 2004 this is 0.02 W m-2. IPCC
Sea level Anomalies Altimeter Argo Ocean heat content = Thermosteric GRACE Ocean mass sea level Willis, Chambers, Nerem JGR 2008
Sea level 2003-2008 mm/yrCazenave et al 2009 GPC.
Sea level Anomalies Altimeter Argo Ocean heat content = Thermosteric GRACE Ocean mass sea level Leuliette and Miller 2009
ARGO Sea level Anomalies Ocean heat content = Thermosteric Differences between Leuliette and Miller 2009 and Willis et al 2008 -0.5± 0.5 mm/yr vs +0.8± 0.8 mm.yr
Commentary • It is possible to reconcile recent changes in sea level. • Depends a lot (uncomfortably so) on Glacial Isostatic Adjustment in GRACE • Implication is that since 2003, main source of sea level rise is melting of Greenland and Antarctica, and glaciers. • These require about a factor of 50 less heat to produce same sea level rise as expansion • If correct, implies a slow down in ocean heat uptake and reduced TOA energy imbalance in past 4 years. • Does NOT solve energy imbalance problem.
Need to know energy balanceWhat about clouds? • Cloud data (ISCCP, HIRS, Modis, etc)??? • ISCCP into 2007, but not homogeneous • CERES data on TOA radiation??? • Some stuff available: Flashflux: CERES plus MODIS clouds http://eosweb.larc.nasa.gov/PRODOCS/flashflux/table_flashflux.html
HIRS cloud amount trends Wylie et al 2005
CERES data1. QC official product to Oct 2005 (green)2. CERES preliminary (yellow): MTSAT (Japan) problem begins Nov 20053. Flashflux data (pink); discon Jan 2008 in OLR OLR RSW Net Radiative Anomalies W m-2
Where does energy go? 1020 Joules/yr
Need to know energy balance • A 1% increase in clouds is about -0.5 W m-2 • Need reliable clouds and radiation data in closer to real time. Is global warming continuing?
Geoengineering • Given that we can not adequately track what is going on now, what business have we even considering geoengineering? • The intentional modification of climate • Risk of serious side effects is real
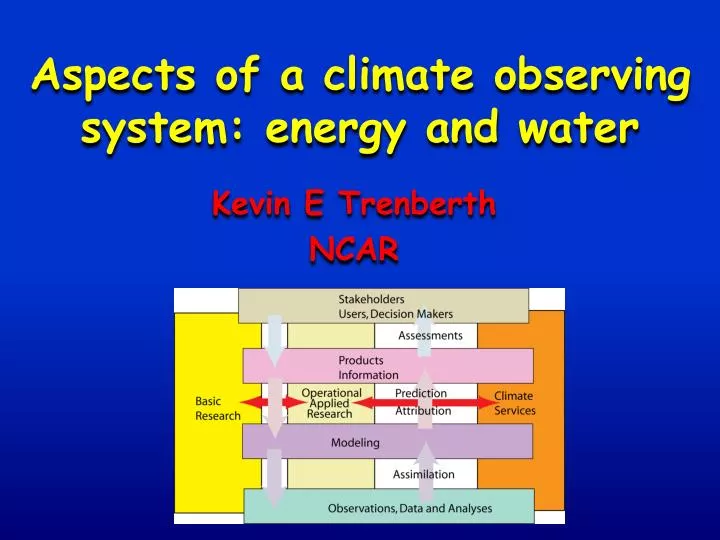
Climate Information System Trenberth 2008
ImperativeA climate information system • Observations: forcings,atmosphere, ocean, land • Analysis: comprehensive, integrated, products • Assimilation: model based, initialization • Attribution: understanding, causes • Assessment: global, regions, impacts, planning • Predictions: multiple time scales • Decision Making: impacts, adaptation An Integrated Earth System Information System