Download
1 / 7
70 likes | 161 Vues
Offshore China. Over Japan. Slope (> 840 mb) = 22 R 2 = 0.45. Slope (> 840 mb) = 51 R 2 = 0.76. REGIONAL [CO 2 ]:[CO] CORRELATIONS PROVIDE UNIQUE INFORMATION ON SOURCE REGION AND TYPE. A priori bottom-up. CO 2. CO 2. CO. CO. Top-down information.

E N D
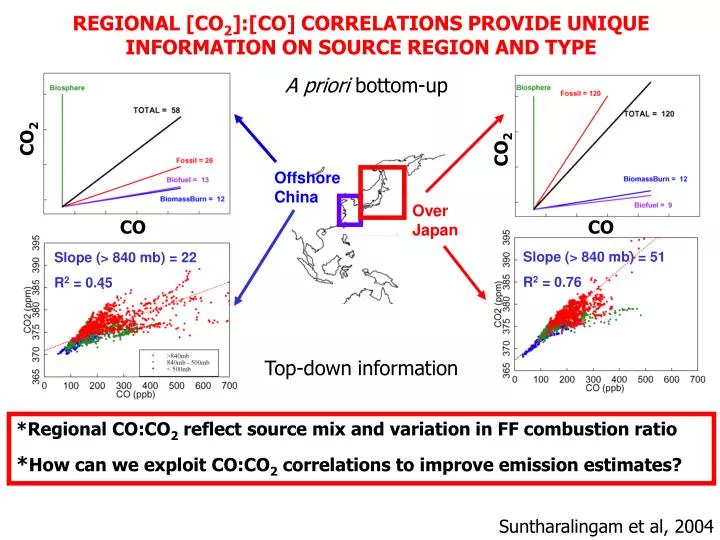
Offshore China Over Japan Slope (> 840 mb) = 22 R2 = 0.45 Slope (> 840 mb) = 51 R2 = 0.76 REGIONAL [CO2]:[CO] CORRELATIONS PROVIDE UNIQUE INFORMATION ON SOURCE REGION AND TYPE A priori bottom-up CO2 CO2 CO CO Top-down information *Regional CO:CO2 reflect source mix and variation in FF combustion ratio *How can we exploit CO:CO2 correlations to improve emission estimates? Suntharalingam et al, 2004
Modeling Approach Jacobian describes CTM y = Kxa + Forward model (GEOS-CHEM) Inverse model ^ x = xa + (KTSy-1K + Sa-1)-1 KTSy-1(y – Kxa) x = Fluxes of CO and CO2 from Asia (Tg C/yr) y = TRACE-P CO and CO2 concentration data State vector (Emissions x) Consistent CO and CO2 Emissions Observation vector y
GEOS-CHEM GEOS-CHEM Performance Remove CO2 bias using 10th percentile of [CO2]: 4-4.5 ppm 4-6 km TRACE-P Data 2-4 km CO [ppb] CO2 [ppm] 0-2 km Latitude [deg]
GEOS-CHEM All latitudes RRE Mean bias TRACE-P GEOS-CHEM 2x2.5 cell Altitude [km] CO Error specification for CO and CO2 Sy*Measurement accuracy *Representation *Model error (most important) SaAnthropogenic (c/o Streets) Biomass burning: 50% 30%Chemistry (~CH4): 25% Biosphere: 75% RRE = total observation error (y*RRE)2 ~38ppb (CO) ~1.87ppm (CO2) (measured-GEOS-CHEM) /measured
Uncorrelated inversion of CO and CO2 emissions Anthropogenic CO2 Biospheric CO2 CO2 emissions [Tg yr-1] CO2 emissions [Tg March 2001] Anthropogenic CO A priori A posteriori K ~ CO emissions [Tg yr-1] Results consistent with CO inverse modeling and [CO2]:[CO] analysis 1
Origin of CO:CO2 Correlations Coal-burning cook stoves in Xian, China warm air cold air E.g., frontal system Compute [CO]:[CO2] correlations from TRACE-P Colocated Emissions Atm. Dyn. Processes Emissions (Tg C yr-1) Emission Factor (TgC / Tg fuel) E = AF Activity Rate (Tg fuel yr-1) (amount of fuel burned) Sa Sy
ECO = (A + AA) (FCO + COFCO) ECO2 = (A + AA) (FCO2 + CO2FCO2) N CO:CO2 correlation China + Taiwan China N 1 Frac. FCO A posteriori certainty relative to uncorrelated inversion [%] CHINA 1 0.1 Frac. A -1 -0.5 0 0.5 1 Modeling CO and CO2 emission correlations