Download
1 / 22
220 likes | 407 Vues
Integrated Waterbird Management & Monitoring Program IWMM. Andy Wilson USGS Patuxent , Laurel, Maryland amwilson@usgs.gov. What is the IWMM Program?. The integration of management, data and decisions at the local, regional and flyway scale.

E N D
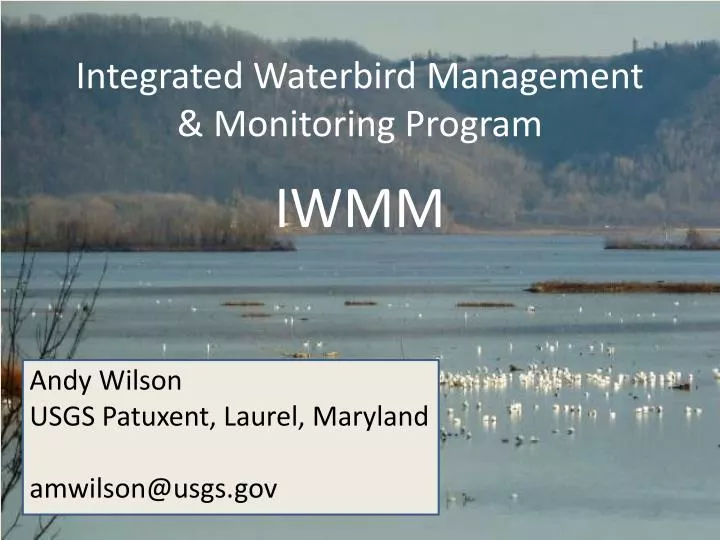
Integrated Waterbird Management & Monitoring Program IWMM Andy Wilson USGS Patuxent, Laurel, Maryland amwilson@usgs.gov
What is the IWMM Program? The integration of management, data and decisions at the local, regional and flyway scale.
Problem:difficulty of managing wetlands for a wide range of species, in changing landscapes
Where did IWMM come from? “What is the best way to manage this wetland?” “What is this wetlands highest and greatest contribution to flyway conservation efforts?” “How should this wetland be managed to optimize stopover quality?” “How does the bird use and management of this wetland compare to other wetland units?”
“How do I allocate funds among wetland units in an informed and transparent way?” “Which wetlands are important to waterfowl …. shorebirds ….. wading birds?” “If I allocate more funds and staff which areas will significantly increase this region’s contribution to flyway conservation efforts?”
“Where, when and in what numbers are migratory birds using stopover habitats?” “Where in a flyway should we focus acquisition and restoration activities?” “Are there important sites within this flyway that are not protected?”
Key Management Decisions Flyway: when, where, how much habitat? SHC Regional: optimal allocation of funds Local: optimal management strategies Adaptive Management
Linking Management Decisions with Data • Improved Resource Contributions • Good Decisions • Supported by defensible data • Clearly Documented Decisions • Promote understanding of decision making process • Reduce controversy
IWMM Evolution • Structured decision making workshops at NCTC • Need for integration across spatial scales • Steering Group formed in 2009 • Protocol Development in 2010 • Lots of partners • Model development 2010-2012 • Pilot Season 2010/2011 • Operational later in 2011 or 2012 • Build organically • Program success will depend on development of useful tools
Flyway Identify Critical Waterbird Sites • Conservation Priorities • Habitat Deficiencies Local Actions Determine Optimal Wetland Management Scenario • Habitat Conditions • Focal Species • Monitoring Data: • Habitat Quality • Bird Use • Evaluation of Site Contribution State / Region Determine Funding Distribution • Land Acquisition Priorities • Conservation Priorities • Bird Use:Cost Analysis • Site Potential • Allocation of Staff & Funds • Management Decisions: • Mgmt. Actions • Costs • Land Acquisition Priorities • Conservation Priorities
Flyway Model Components include GIS data layers and biological parameters (from literature)
Flyway Model Path 1 = 1706 Birds Path 2 = 530 Birds
Regional and local allocation: cost effectiveness αAH2 ∆2 αAH1 Bird Use (B) ∆1 ∆3 αAH3 Funds AH = Available Habitat B= Contribution of Bird-Days
2010/2011 Pilot Season • Test basic Vegetation Survey and Bird Survey Protocols • Highlight key constraints for effective data collection • Recommend modification for basic methods and development of more detailed techniques where needed • Use “real data” to test Structured Decision Making Models
Vegetation Surveys twice per season • Designed to be simple – mass participation! • Based on expert knowledge - >20 biologists consulted
Use “site condition” to make predictions… • The model will allow us to predict change in BUDs due to changes in habitat (ultimately management) • Scores all units on a comparable scale for each guild e.g. site 3 is a diving duck site – flyway model might suggest it would contribute more as a dabbler site
Management increases habitat-value index for site from 40 to 60
Bird-use days/ha (dabblers) predicted to increase from 40/ha to 250/ha ∆ buds on a 10 ha site = 2,100 ∆ buds on a 200 ha site = 42,000
Moving forward • Lots of challenges remain: • Protocols, large areas, inaccessible wetlands • Very complex and ambitious program, steep learning curve, progress may not be linear! • Long-term funding • Scale • Other taxa? • Four regional teams (NA, SA, UM, LM) • Online data system • Ensure we keep learning lessons!
Acknowledgements • Over 60 individuals - program development • Over 90 participants in pilot season • Partners: • FWS, USGS • State agencies • Ducks Unlimited • LCCs and JVs • Universities • Lincoln Park Zoo • PRBO Hal Laskowski