Download
1 / 1
10 likes | 64 Vues
Modeling the Effect of Shocks and Stresses on the Reliability of Networks with Radial Topologies. Results.

E N D
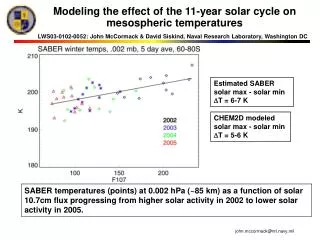
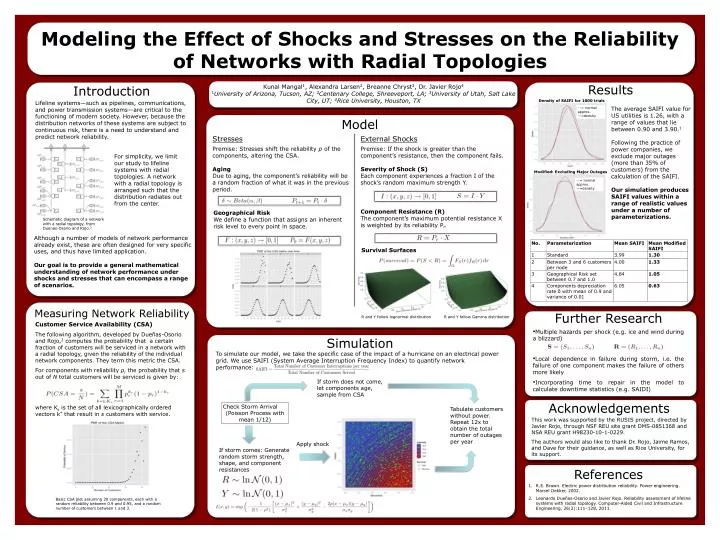
Modeling the Effect of Shocks and Stresses on the Reliability of Networks with Radial Topologies Results Kunal Mangal1, Alexandra Larsen2, Breanne Chryst3, Dr. Javier Rojo41University of Arizona, Tucson, AZ; 2Centenary College, Shreeveport, LA; 3University of Utah, Salt Lake City, UT; 4Rice University, Houston, TX Introduction Density of SAIFI for 1000 trials Lifeline systems—such as pipelines, communications, and power transmission systems—are critical to the functioning of modern society. However, because the distribution networks of these systems are subject to continuous risk, there is a need to understand and predict network reliability. The average SAIFI value for US utilities is 1.26, with a range of values that lie between 0.90 and 3.90.1 Following the practice of power companies, we exclude major outages (more than 35% of customers) from the calculation of the SAIFI. Our simulation produces SAIFI values within a range of realistic values under a number of parameterizations. —= normal approx. —=density Model Stresses Premise: Stresses shift the reliability p of the components, altering the CSA. Aging Due to aging, the component’s reliability will be a random fractionof what it was in the previous period. External Shocks Premise: If the shock is greater than the component’s resistance, then the component fails. Severity of Shock (S) Each component experiences a fraction I of the shock’s random maximum strength Y. Component Resistance (R) The component’s maximum potential resistance X is weighted by its reliability Pr. For simplicity, we limit our study to lifeline systems with radial topologies. A network with a radial topology is arranged such that the distribution radiates out from the center. Modified: Excluding Major Outages —= normal approx. —=density Geographical Risk We define a function that assigns an inherent risk level to every point in space. Schematic diagram of a network with a radial topology, from Duenas-Osorio and Rojo.2 Although a number of models of network performance already exist, these are often designed for very specific uses, and thus have limited application. Our goal is to provide a general mathematical understanding of network performance under shocks and stresses that can encompass a range of scenarios. Survival Surfaces Measuring Network Reliability Further Research R and Y follow lognormal distribution R and Y follow Gamma distribution Customer Service Availability (CSA) The following algorithm, developed by Dueñas-Osorio and Rojo,2 computes the probability that a certain fraction of customers will be serviced in a network with a radial topology, given the reliability of the individual network components. They term this metric the CSA. For components with reliability prthe probability that s out of N total customers will be serviced is given by: where Ks is the set of all lexicographically ordered vectors k* that result inscustomers with service. • Multiple hazards per shock (e.g. ice and wind during a blizzard) • Local dependence in failure during storm, i.e. the failure of one component makes the failure of others more likely • Incorporating time to repair in the model to calculate downtime statistics (e.g. SAIDI) Simulation To simulate our model, we take the specific case of the impact of a hurricane on an electrical power grid. We use SAIFI (System Average Interruption Frequency Index) to quantify network performance: If storm does not come, let components age, sample from CSA Acknowledgements Check Storm Arrival (Poisson Process with mean 1/12) Tabulate customers without power. Repeat 12x to obtain the total number of outages per year This work was supported by the RUSIS project, directed by Javier Rojo, through NSF REU site grant DMS-0851368 and NSA REU grant H98230-10-1-0229. The authors would also like to thank Dr. Rojo, Jaime Ramos, and Dave for their guidance, as well as Rice University, for its support. Apply shock If storm comes: Generate random storm strength, shape, and component resistances References • R.E. Brown. Electric power distribution reliability. Power engineering. Marcel Dekker, 2002. • Leonardo Dueñas-Osorio and Javier Rojo. Reliability assessment of lifeline systems with radial topology. Computer-Aided Civil and Infrastructure Engineering, 26(2):111–128, 2011. Basic CSA plot assuming 20 components, each with a random reliability between 0.9 and 0.95, and a random number of customers between 1 and 3.