Download
1 / 24
240 likes | 382 Vues
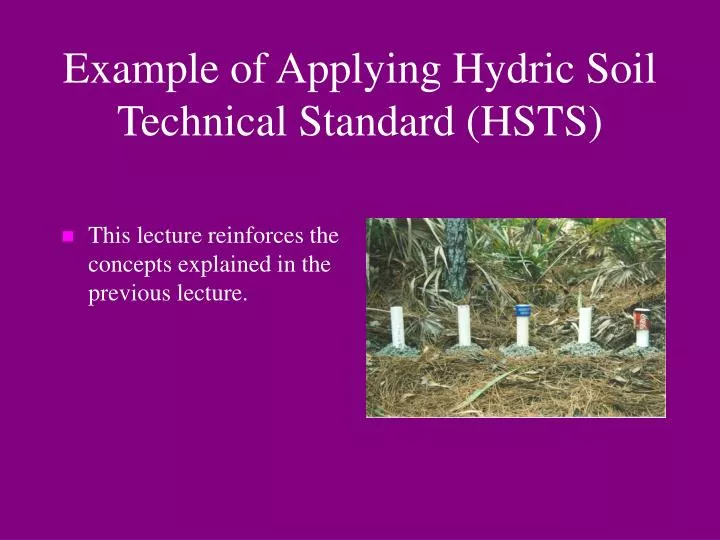
Example of Applying Hydric Soil Technical Standard (HSTS). This lecture reinforces the concepts explained in the previous lecture. Introduction.

E N D
Example of Applying Hydric Soil Technical Standard (HSTS) • This lecture reinforces the concepts explained in the previous lecture.
Introduction This lecture provides an example of the application of the Hydric Soil Technical Standard (HSTS) used to make hydric soil determinations based on Data. Two types of data are analyzed for Anaerobic Conditions and if one of these two data set pass the HSTS, the soil is considered to have been proven to meet the Anaerobic Conditions part of the HSTS. One type of data is analyzed for Saturated Conditions and if it passes the HSTS, the soil is considered to have been proven to meet the Saturated Conditions part of HSTS. Both the Anaerobic Conditions part of the HSTS and the Saturated Conditions part of HSTS must be met for the soil to be considered hydric. In situ pH and precipitation data are also needed to apply the HSTS. “Normal” precipitation is explained again.
Proposal to NTCHS An individual has requested that the NTCHS revise Indicator S6, Stripped Matrix, (Hurt, et al. 2002) from “A layer starting within 15 cm …” to “A layer starting within 20 cm …” The rest of the indicator requirements remain the same. Data were collected to determine validity of proposed revision.
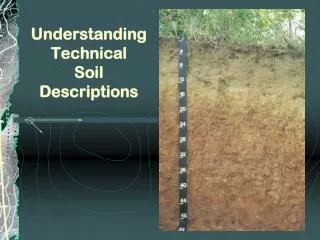
Soil Profile Description 0-5 cm 60% 10YR 5/2 and 40% 10YR 2/1 sand 5-12 cm 75% 10YR 2/1 and 25% 10YR 5/2 sand 12-17 cm 60% 10YR 5/2 and 40% 10YR 2/1 sand 17-35 cm 60% 10YR 5/2, 20% 10YR 7/1, and 20% 10YR 6/2 sand (Indicator S6, Stripped Matrix)
On-site Features Precipitation data were collected Dry-wet-dry cycle for this area is October to April
“Normal” Precipitation For the purposes of applying the HSTS the definition of “Normal” precipitation is the average monthly precipitation (50%) + 20%. This would be the 30-70% probability of occurrence. Another way to express this range is that during any given 10 years of precipitation data collection on the average for any given month 4 of 10 years would have precipitation within this range for that month; 3 would have lower and 3 would have higher precipitation for that or any month.
“Normal” Precipitation In order to be able to apply data collected (Eh, dye, and saturation data) to the HSTS on-site precipitation have to fall within the 30-70% range during the dry-wet-dry cycle for the area. Therefore for this site data would be collected for the months of October through April and if the precipitation falls within the 30-70% range, then the other data can be used to see if the HSTS is met. In the following slide data collected at this site are presented for the October, 2000 through April 2001 period and plotted along with the 30 and 70% probability (NRCS, National Water and Climate Center).
Checking Normal Precipitation From the data shown on the previous slide we see that precipitation data collected for the period of October, 2000 through April 2001 fall between the 30 and 70 % probability of occurrence (the height of the green bars for 2000 and the blue bars for 2001 are between the heights of the red and yellow bars). On-site precipitation data is compared with the data from the nearest weather station. These data (30-70%) are available at http://www.wcc.nrcs.usda.gov/water/wetlands.html for thousands of weather stations nationwide.
Dry-Wet-Dry Cycles Dry-wet-dry cycles are not only a function of precipitation but also a function of evapotraspiration and snow melt. Evapotraspiration is a function of the types and amounts of plants present, wind velocity, air temperature, and amount of water in the soil. Local soil/wetland scientists should be consulted if necessary.
Anaerobic Conditions and Saturated Conditions Data Anaerobic Conditions are verified by Platinum Electrode Data or Alpha-Alpha-Dipyridyl Data. Saturated Conditions are verified by Piezometer Data. Data presented represent the most reduced and saturated periods. Data presented are for March 1, March 8, and March 15. Three consecutive weakly reading is the minimum requirement; two is not enough. If only two consecutive weakly reading are reported the NTCHS could interpret the data as representing 8 days (March 1 -March 8) and the HSTS requires 14 days of data for comparison.
5 Platinum electrodes were installed at 12.5 cm as measured from the mineral soil surface (because soils are sandy and no muck was present). For most loamy or clayey soils the depth would have been 25 cm.
Platinum Electrode Data Dates: Mar 1 Mar 8 Mar 15 Electrode #1 = 201 mv 189 mv 201 mv Electrode #2 = 233 mv 177 mv 167 mv Electrode #3 = 103 mv 100 mv 113 mv Electrode #4 = 252 mv 252 mv 252 mv Electrode #5 = 189 mv 160 mv 180 mv Soil pH was 6.6 on all dates
Eh/pH Line (-60) for Determining Aerobic and Anaerobic Conditions with data points for March 1 are indicated by the arrows Aerobic Conditions Exist Anaerobic Conditions Exist
Interpretation of Eh/pH Data • Based on the Eh/pH line of 175 mv for pH 7 adjusted for pH with a slope of negative 60 the critical Eh for pH 6.6 would be 199 mv. Thus Anaerobic Conditions = Eh of < 199 and Aerobic Conditions = Eh of > 199. • Mar 1: 2 of 5 were Anaerobic • Mar 8: 4 of 5 were Anaerobic • Mar 15: 3 of 5 were Anaerobic
Electrode Data Analysis • Data are not summarized. • Data from each electrode are presented separately. • Data summarization would have been: • Mar 1 196 mv (Anaerobic) • Mar 8 176 mv (Anaerobic) • Mar 15 183 mv (Anaerobic) • Compare the results of summarization Vs. reporting data from all electrodes. Platinum electrodes often fail; note that one electrode recorded a value of near 100 (Electrode 3) for each of the three weekly readings (the electrode may be faulty). By analyzing all data, suspect data can better be analyzed.
Alpha-Alpha-Dipyridyl Data and Data Analysis Dates Mar 1 Mar 8 Mar 15 Sample #1 Yes No Yes Sample #2 Yes Yes Yes Sample #3 No Yes No Yes = positive reaction in at least 1/2 of the upper 12.5 cm. No = no positive reaction in at least 1/2 of the upper 12.5 cm.
2 piezometers were installed at 25 cm. 2 piezometers were installed at 100 cm. An open well to a depth of 2 m was also installed.
Saturation Data and Data Analysis of the two 25 cm Piezometers • Dates: Mar 1 Mar 8 Mar 15 • Piezometer 1 Yes Yes Yes • Piezometer 2 No Yes Yes • Yes = Water in piezometer • No = No water in piezometer • Summary No* Yes Yes • *Water has to be in both piezometers.
HSTS Data Analysis Dates: Mar 1 Mar 8 Mar 15 Anaerobic (Eh) No Yes Yes Anaerobic (dye) Yes Yes Yes Saturated No Yes Yes Has the soil been proven to be hydric? Is the proposed revision valid? Does the NTCHS accept the proposed change to Indicator S6 (Stripped Matrix)?
HSTS Data Analysis • Has this soil been proven to be hydric? This is a 2 part test. • Has the Anaerobic Conditions part of the HSTS been met? • Remember the Eh and dye data are analyzed for Anaerobic Conditions and if one of these two types of data collected pass the HSTS, the soil is considered to have been proven to meet the HSTS. • This soil meets Anaerobic Conditions for at least 14 consecutive days based on the dye data. This soil does not meet anaerobic conditions for at least 14 consecutive days based on the Eh data. • The soil meets the anaerobic conditions part of the HSTS • Has the Saturated Conditions part of the HSTS been met? • The soil is not known to be saturated for at least 14 consecutive days based on the piezometer data; only 8 days. • This soil fails the Saturated Conditions part of the HSTS. • This soil has not been proven to be hydric. • Is the proposed revision valid? NO • Does the NTCHS accept the proposed change to Indicator S6 (Stripped Matrix)? NO
Literature Cited Hurt, G.W., P.M. Whited, and R.F. Pringle ( Eds.). 2002. Field indicators of hydric soils in the United States (Version 5.0), USDA, NRCS, Fort Worth, TX. http://soils.usda.gov/soil_use/hydric/field_ind.pdf National Technical Committee for Hydric Soils. 2001. Hydric Soil Technical Standard (Technical Note 11). http://soils.usda.gov/soil_use/hydric/hstn.htm NRCS, National Water and Climate Center. (http://www.wcc.nrcs.usda.gov/water/climate/)