Download
1 / 19
190 likes | 319 Vues
S TUDIES OF THE M ARTIAN A TMOSPHERE WITH PFS : T HERMAL P ROFILES. M. Giuranna * marco.giuranna@ifsi-roma.inaf.it * Istituto di Fisica dello Spazio Interplanetario (IFSI/INAF), Via del Fosso del Cavaliere 100, 00133 Roma, Italy.

E N D
STUDIES OF THE MARTIAN ATMOSPHERE WITH PFS:THERMAL PROFILES M. Giuranna* marco.giuranna@ifsi-roma.inaf.it *Istituto di Fisica dello Spazio Interplanetario (IFSI/INAF), Via del Fosso del Cavaliere 100, 00133 Roma, Italy. MEx and VExDATA WORKSHOP - PFS and SOIR experiments - 27 June - 1st July 2011, ESA/ESAC,Spain
With the Temperature profiles you can study: • Global scale • (e.g., global circulation, weather and climate, dust storms…) • Regional scale • (e.g., polar regions, planetary waves, dust storms…) • Local scale • (e.g., Olympus Mons, Valles Marineris, dust storms…) Workshop Mars III – Les Houches – 28 March - 2 April 2010
Seasonal evolution of mean Meridional Temperature and Zonal Wind derived from PFS-MEX(M. Giuranna et al., in preparation) Ls 330°-360° Ls 0°-30° Temperature fields: Confirmation of hemispherical symmetry (asymmetry) during equinoxes (solstices). Hadley Circulation: Evidences for meridional circulation (Hadely cells). Confirmation of two Hadley Cells during equinoxes. Zonal Winds (geostrophic approx): Comparison with TES: very good agreement . Comparison with models: good agreement for fields structure, less for numerical values. Ls 90°-120° Ls 120°-150° PFS MGCM (EMCD 4.1) Ls 30°-60° Ls 60°-90° Ls 180°-210° Ls 150°-180° TES MEx and VExDATA WORKSHOP - PFS and SOIR experiments - 27 June - 1st July 2011, ESA/ESAC,Spain
Quasi-Stationary Planetary Waves (Strongest in the afternoon) Seasonal evolution of mean Meridional Temperature and Zonal Wind derived from PFS-MEX(M. Giuranna et al., in preparation) South Winter South Spring Morning Afternoon MEx and VExDATA WORKSHOP - PFS and SOIR experiments - 27 June - 1st July 2011, ESA/ESAC,Spain
With the Temperature profiles you can study: • Global scale • (e.g., global circulation, weather and climate, dust storms…) • Regional scale • (e.g., polar regions, planetary waves, dust storms…) • Local scale • (e.g., Olympus Mons, Valles Marineris, dust storms…) MEx and VExDATA WORKSHOP - PFS and SOIR experiments - 27 June - 1st July 2011, ESA/ESAC,Spain
PFS/MEX observations of the condensing CO2 south polar cap of Mars (M. Giuranna et al., 2008, Icarus 197, 386–402) The thermal radiation measured by the LWC allows the simultaneous retrieval of several key-quantities, such as the surface temperature and the air thermal fields up to an altitude of about 50 Km, even during the polar nights. By comparing the measured vertical temperature profiles with the CO2 condensation temperature at different altitudes we can establish if, where and at which altitudes CO2 snow falls may be allowed. RSPC Asymmetry …a major issueformanyyears The CO2 ice survives all year long on the RSPC. On the basis of the surface temperatures, we can monitor the extension and the evolution of the CO2 deposits by tracking the seasonal cap edges as a function of season and longitude. If the atmospheric temperatures are always above the CO2 condensation temperature in the whole column, the snowfall hypothesis can be undoubtedly rejected. The residual south polar cap is approximately 400 Km across and the cap center is displaced by 3° from the geographic pole. Soon after the end of the summer (Ls 0-25°), the asymmetry observed for the residual cap has already vanished, the cap appears symmetric and extends up to –70° latitude. In early-fall, the CO2 condensation in the atmosphere is not allowed, the atmospheric temperature being always several degrees above the CO2 condensation temperature at any altitude. Cover Art of ICARUS Oct 2008 issue Whether the CO2 ice, at these Ls, is frost or snow cannot be addressed only on the basis of the surface temperatures. In both cases these temperatures are similar, forced by the vapor pressure equilibrium with the atmosphere (Giuranna et al., 2007a). The vertical temperature profiles allow us to straightforwardly answer the question. Thisasymmetrycannot be straightforwardly explained by the orbital asymmetry or a local topographic difference, neither by energy balance theoretical models. The early-fall south polar cap essentially consists of CO2frost deposits (direct vapor deposition). Longitude cross-section at –85° latitude showing T – TSAT as a function of altitude. MEx and VExDATA WORKSHOP - PFS and SOIR experiments - 27 June - 1st July 2011, ESA/ESAC,Spain
PFS/MEX observations of the condensing CO2 south polar cap of Mars (M. Giuranna et al., 2008, Icarus 197, 386–402) These two distinct regional climates are the main responsible for the residual south polar cap asymmetry. The mid-late fall season offers a much more complex scenario: CO2 snow falls are now allowed, but they occur exclusively in the western hemisphere. CO2 snowfalls In the eastern hemisphere (40°–220° east-longitude), the whole atmospheric column is several degrees above the saturation temperature; here, the direct vapor deposition is the only allowed mechanism for the CO2 ice accumulation and the South polar cap essentially consists of CO2frost deposits. Direct vapor deposition In the western hemisphere, atmospheric condensation is allowed in the entire 0-30 km column; surface ice accumulation is dominated by precipitation. Ls 50-70° Longitude cross-section at –85° latitude showing T – TSAT as a function of altitude. MEx and VExDATA WORKSHOP - PFS and SOIR experiments - 27 June - 1st July 2011, ESA/ESAC,Spain
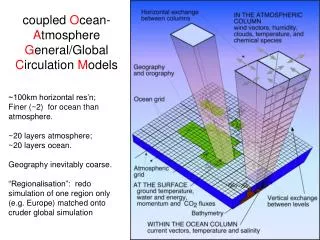
PFS/MEX observations of the condensing CO2 south polar cap of Mars (M. Giuranna et al., 2008, Icarus 197, 386–402) THE TWO REGIONAL CLIMATES ARE THE RESULT OF DYNAMICAL FORCING BY THE LARGEST SOUTHERN IMPACT BASINS, ARGYRE AND HELLAS Atmospheric temperature at different heights 140K 171K 109K The general circulation of Mars is characterized by strong eastward winds in the fall-winter hemisphere. The interaction of this flow with zonally varying topography excitesstationary waves, which take the form of planetarywaves for forcing at the largest horizontal scales. Hellas South Pole The wave achieves its largest amplitude of about 15K near 45 km altitude and 60°S where the phase is about 40°E. Hence, the peak positive temperature perturbation lies above the southwest edge of Hellas. The wavenumber-one planetary wave has upwelling in the western hemisphere, resulting in adiabatic cooling, and downwelling in the eastern hemisphere, which produces adiabatic warming. MEx and VExDATA WORKSHOP - PFS and SOIR experiments - 27 June - 1st July 2011, ESA/ESAC,Spain
CO2 snowfalls Direct vapor deposition PFS/MEX observations of the condensing CO2 south polar cap of Mars (M. Giuranna et al., 2008, Icarus 197, 386–402) The wavenumber-one planetary wave establishes a high-pressure zone over much of the eastern hemisphere, preventing CO2 condensation in the atmosphere during the Fall season. Different amounts of CO2 ice deposited in the two hemispheres; different sublimation rates due to different grain sizes between CO2 (fresh) snow and frost; different amount of heat stored in the subsurface: The dry ice sublimes entirely in the eastern hemisphere, while in the western hemisphere it survives all year long as the RSPC. MEx and VExDATA WORKSHOP - PFS and SOIR experiments - 27 June - 1st July 2011, ESA/ESAC,Spain
With the Temperature profiles you can study: • Global scale • (e.g., global circulation, weather and climate, dust storms…) • Regional scale • (e.g., polar regions, planetary waves, dust storms…) • Local scale • (e.g., Olympus Mons, Valles Marineris, dust storms…) MEx and VExDATA WORKSHOP - PFS and SOIR experiments - 27 June - 1st July 2011, ESA/ESAC,Spain
The atmospheric temperatures over Olympus Mons on Mars: An atmospheric hot ring (P. Wolkenberg et al., 2010, Icarus, in press) • Striking features: • There are three striking features characterizing the volcanic region: • two warm regions (north and south of the volcano at 8° N and 26° N, i.e. respectively at 10° and 8° latitudinal distance, which we shall call thermal bumps or hot ring); • two cold regions almost vertically isothermal (temperature at 40 km 10 K higher than surrounding) • one region on top the volcano with a high temperature just above it, decreasing quicker with altitude, where the coldest temperature of the entire region is also observed. • The surface temperature shows no special feature. To understand the meaning of the three features mentioned above, we now study some single atmospheric temperature profile. MEx and VExDATA WORKSHOP - PFS and SOIR experiments - 27 June - 1st July 2011, ESA/ESAC,Spain
The atmospheric temperatures over Olympus Mons on Mars: An atmospheric hot ring (P. Wolkenberg et al., 2010, Icarus, in press) Interpretation: The hot spot on top of the volcano acts as the motor for a mesoscale circulation. Solar heating: the local air parcels reach a temperature so high that they become unstable and move upward, with strong adiabatic expansion. A cold collar is generated at the foot of the volcano: air parcels are sucked upward , and adiabatically cooled. At some level the air parcels are pushed side ways resulting in a quasi isothermal vertical profile. Finally, the air parcels fall downward and are compressed adiabatically. They follow the adiabatic lapse rate and form a ‘‘hot ring” around Olympus Mons. Blue: The air parcel on top of Olympus Mons is thermally buoyant: the potential temperature there is decreasing with altitude (negative slope for at least 5–7 km) and it is an indication of unstable atmosphere. Black: This is the temperature profile inside the hot region observed at 8° N latitude. It follows well the adiabatic lapse rate in the last 10 km. Red: This profile, relative to the cold collar around the volcano, inside the hot ring, shows less than half the vertical temperature variation of the other profiles, justifying the pseudo ‘isothermal’ impression obtained from the previous figure. • Striking features: • There are three striking features characterizing the volcanic region: • two warm regions (north and south of the volcano at 8° N and 26° N, i.e. respectively at 10° and 8° latitudinal distance, which we shall call thermal bumps or hot ring); • two cold regions almost vertically isothermal (temperature at 40 km 10 K higher than surrounding) • one region on top the volcano with a high temperature just above it, decreasing quicker with altitude, where the coldest temperature of the entire region is also observed. • The surface temperature shows no special feature. We shall call this mesoscale circulation: The Fountain Model MEx and VExDATA WORKSHOP - PFS and SOIR experiments - 27 June - 1st July 2011, ESA/ESAC,Spain
The atmospheric temperatures over Olympus Mons on Mars: An atmospheric hot ring (P. Wolkenberg et al., 2010, Icarus, in press) 2 km 5 km The “Hot Ring” The “Hot Ring” 10 km 20 km The “Cold Collar” The “Hot Spot” (motor of the mesoscale circulation) MEx and VExDATA WORKSHOP - PFS and SOIR experiments - 27 June - 1st July 2011, ESA/ESAC,Spain
With the Temperature profiles you can study: • Global scale • (e.g., global circulation, weather and climate, dust storms…) • Regional scale • (e.g., polar regions, planetary waves, dust storms…) • Local scale • (e.g., Olympus Mons, Valles Marineris, dust storms…) MEx and VExDATA WORKSHOP - PFS and SOIR experiments - 27 June - 1st July 2011, ESA/ESAC,Spain
Fog phenomena on Mars(D. T. F. Möhlmann et al., 2009, PSS 57) HRSC images show impressive morning fog features inside Valles Marineris and other regions of the surface of Mars. Temperatures have been determined simultaneously to the imaging by PFS. This identifies water ice rather than frozen CO2 as the cause of the fog observations. Numerical estimates of the water vapor pressure and atmospheric water content at the frost-point by a 1-dimensional planetary boundary layer model indicate that conditions in the planetary boundary layer can indeed temporarily favor the formation of ice particles. The fog phenomena seem to be induced or supported by orographic effects but not directly by the distribution pattern of the atmospheric vapor or by the regional subsurface water content. Fig. 2. (a) PFS measured spectra inside (2), on the edge of (3) and outside (1) Valles Marineris. Spectrum 2 shows lower temperatures and the water ice band at 750–900 cm-1. (b) Surface temperature (solid), height profile (dash-dot) and sun elevation (dashed) across Valles Marineris, measured by PFS for the same part of MEX-orbit 438 as in Fig. 1. Fig. 1. Morning fog in Valles Marineris at LS = 38°. The image center is at 14.17°S latitude, 302°E longitude. Local time is 9:20a.m.(May25,2004, orbit438). Colors are calibrated to improve the visibility of fog. This false color image enhances the visibility of fog phenomena in the valley. MEx and VExDATA WORKSHOP - PFS and SOIR experiments - 27 June - 1st July 2011, ESA/ESAC,Spain
With the Temperature profiles you can study: • Global scale • (e.g., global circulation, weather and climate, dust storms…) • Regional scale • (e.g., polar regions, planetary waves, dust storms…) • Local scale • (e.g., Olympus Mons, Valles Marineris, dust storms…) MEx and VExDATA WORKSHOP - PFS and SOIR experiments - 27 June - 1st July 2011, ESA/ESAC,Spain
A study of the properties of a local dust storm with MeX OMEGA and PFS data (Määttänen et al ., 2009, Icarus 201, 504–516) In the core of the dust storm, the temperatures near the surface and at 30 Pa, were ∼10 K colder and ∼5 K warmer, respectively Thermal fingerprint of the Local dust storm Ls = 135° MY = 27 Lat = 3° S Lon = 24.7° LT =13.30 Atmospheric dust tends to homogenize the vertical temperature profile. We observe the same trend in our temperature profiles, but with a weaker amplitude than for the regional or global dust storms previously studied. Net cooling close to the surface and net heating in the upper atmosphere, as expected from theoretical considerations (Gierasch and Goody, 1972). MEx and VExDATA WORKSHOP - PFS and SOIR experiments - 27 June - 1st July 2011, ESA/ESAC,Spain
PFS-DERIVED STATE VECTORS We built a database of a selection of atmospheric retrievals derived from PFS observations The data includes a total of 335.563 retrievals covering the entire period of MEX orbits 10-7118. Before inclusion in the dataset, retrievals were filtered on the basis of: - Chi square value, to ensure good match between observed and modeled spectra (noteworthy, this filter rejects most of PFS spectra affected by residual calibration issues), - Convergence criteria, to allow only cases where retrieval actually achieved convergence and not merely reached the maximum number of iterations, - Emission angle, to minimize modeling errors related to fast evaluation of CO2 transmission coefficients. Retrieved values include: - surface temperature - dust optical depth @ 1100 cm-1 - ice optical depth @ 830 cm-1 - air temperature vs pressure. Please contact us if you are interested. Marco.giuranna@ifsi-roma.inaf.it MEx and VExDATA WORKSHOP - PFS and SOIR experiments - 27 June - 1st July 2011, ESA/ESAC,Spain