Download
1 / 11
110 likes | 120 Vues
Chapter 8. Hypothesis Testing with Two Samples. Testing the Difference Between Means (Large Independent Samples). § 8.1. Two Sample Hypothesis Testing. In a two - sample hypothesis test, two parameters from two populations are compared. For a two - sample hypothesis test,

E N D
Chapter 8 Hypothesis Testing with Two Samples
Testing the Difference Between Means (Large Independent Samples) § 8.1
Two Sample Hypothesis Testing In a two-sample hypothesis test, two parameters from two populations are compared. • For a two-sample hypothesis test, • the null hypothesis H0 is a statistical hypothesis that usually states there is no difference between the parameters of two populations. The null hypothesis always contains the symbol , =, or . • the alternative hypothesis Ha is a statistical hypothesis that is true when H0 is false. The alternative hypothesis always contains the symbol >, , or <.
H0: μ1 = μ2 Ha: μ1μ2 • H0: μ1μ2 • Ha: μ1>μ2 • H0: μ1μ2 • Ha: μ1<μ2 Two Sample Hypothesis Testing To write a null and alternative hypothesis for a two-sample hypothesis test, translate the claim made about the population parameters from a verbal statement to a mathematical statement. Regardless of which hypotheses used, μ1 = μ2 is always assumed to be true.
Two Sample z-Test Three conditions are necessary to perform a z-test for the difference between two population means μ1 and μ2. • The samples must be randomly selected. • The samples must be independent. Two samples are independent if the sample selected from one population is not related to the sample selected from the second population. • Each sample size must be at least 30, or, if not, each population must have a normal distribution with a known standard deviation.
Sampling distribution for Two Sample z-Test If these requirements are met, the sampling distribution for (the difference of the sample means) is a normal distribution with mean and standard error of and
Two Sample z-Test Two-Sample z-Test for the Difference Between Means A two-sample z-test can be used to test the difference between two population means μ1 and μ2 when a large sample (at least 30) is randomly selected from each population and the samples are independent. The test statistic is and the standardized test statistic is When the samples are large, you can use s1 and s2 in place of 1 and 2. If the samples are not large, you can still use a two-sample z-test, provided the populations are normally distributed and the population standard deviations are known.
Two Sample z-Test for the Means Using a Two-Sample z-Test for the Difference Between Means (Large Independent Samples) In Words In Symbols • State the claim mathematically. Identify the null and alternative hypotheses. • Specify the level of significance. • Sketch the sampling distribution. • Determine the critical value(s). • Determine the rejection regions(s). State H0 and Ha. Identify . Use Table 4 in Appendix B. Continued.
Two Sample z-Test for the Means Using a Two-Sample z-Test for the Difference Between Means (Large Independent Samples) In Words In Symbols • Find the standardized test statistic. • Make a decision to reject or fail to reject the null hypothesis. • Interpret the decision in the context of the original claim. If z is in the rejection region, reject H0.Otherwise, fail to reject H0.
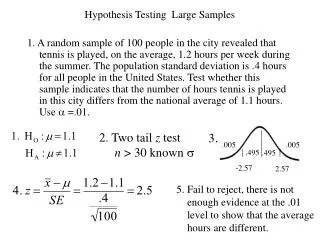
= 0.10 z -3 -2 -1 0 1 2 3 Two Sample z-Test for the Means Example: A high school math teacher claims that students in her class will score higher on the math portion of the ACT then students in a colleague’s math class. The mean ACT math score for 49 students in her class is 22.1 and the standard deviation is 4.8. The mean ACT math score for 44 of the colleague’s students is 19.8 and the standard deviation is 5.4. At = 0.10, can the teacher’s claim be supported? H0:1 2 Ha: 1> 2(Claim) z0 = 1.28 Continued.
Two Sample z-Test for the Means Example continued: H0:1 2 z0 = 1.28 Ha: 1> 2(Claim) z -3 -2 -1 0 1 2 3 The standardized error is Reject H0. The standardized test statistic is There is enough evidence at the 10% level to support the teacher’s claim that her students score better on the ACT.