Download
1 / 18
180 likes | 191 Vues
This lecture discusses population and sample statistics, the use of statistical theory for estimating population statistics, and optimizing experimental design. It covers concepts such as the Central Limit Theorem, Gaussian and Lognormal distributions, and Student's t-distribution for hypothesis testing and confidence intervals.

E N D
Statistical Methods II:Confidence Intervals ChE 477 (UO Lab) Lecture 4 Larry Baxter, William Hecker, & Ron Terry Brigham Young University
Population statistics Characterizes the entire population, which is generally the unknown information we seek Mean generally designated as m Variance & standard deviation generally designated as s2, and s, respectively Sample statistics Characterizes the random sample we have from the total population Mean generally designated Variance and standard deviation generally designated as s2 and s, respectively Population vs. Sample Statistics
Overall Approach • Use sample statistics to estimate population statistics • Use statistical theory to indicate the accuracy with which the population statistics have been estimated • Use trends indicated by theory to optimize experimental design
All Statistical Info Is in pdf • Probabilities are determined by integration. • Moments (means, variances, etc.) Are obtained by simple means. • Most likely outcomes are determined from values.
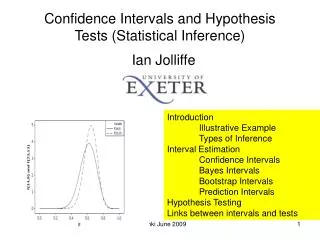
Properties of a Normal pdf • About 68.26%, 95.44%, and 99.74% of data lie within 1, 2, and 3 standard deviations of the mean, respectively. • When mean is zero and standard deviation is 1, it is referred to as a standard normal distribution. • Plays fundamental role in statistical analysis because of the Central Limit Theorem.
Lognormal Distributions • Used for non-negative random variables. • Particle size distributions. • Drug dosages. • Concentrations and mole fractions. • Duration of time periods. • Similar to normal pdf when variance is < 0.04.
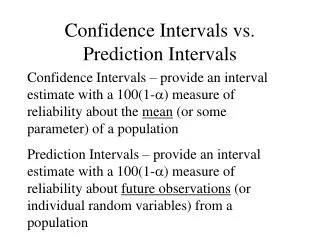
Student’s t Distribution • Widely used in hypothesis testing and confidence intervals • Equivalent to normal distribution for large sample size
Central Limit Theorem • Possibly most important single theory in applied statistics • Deals with distributions of normalized sample and population means • Not quite applicable because it assumes population mean and variance are known
Central Limit Theorem • Distribution of means calculated from data from most distributions is approximately normal • Becomes more accurate with higher number of samples • Assumes distributions are not peaked close to a boundary
Student’s t Distribution • Used to compute confidence intervals according to • Assumes mean and variance estimated by sample values
Values of Student’s t Distribution • Depends on both confidence level being sought and amount of data. • Degrees of freedom generally n-1, with n = number of data points (assumes mean and variance are estimated from data and estimation of population mean only). • This table assumes two-tailed distribution of area.
Sample Size Is Important • Confidence interval decreases proportional to inverse of square root of sample size and proportional to decrease in t value. • Limit of t value is normal distribution. • Limit of confidence interval is 0.
Theory Can Be Taken Too Far • Accuracy of measurement ultimately limits confidence interval to something greater than 0. • Not all sample means are appropriately treated using central limit theorem and t distribution.
Typical Numbers • Two-tailed analysis • Population mean and variance unknown • Estimation of population mean only • Calculated for 95% confidence interval • Based on number of data points, not degrees of freedom
An Example • Five data points with sample mean and standard deviation of 713.6 and 107.8, respectively. • The estimated population mean and 95% confidence interval is: