Download
1 / 18
180 likes | 284 Vues
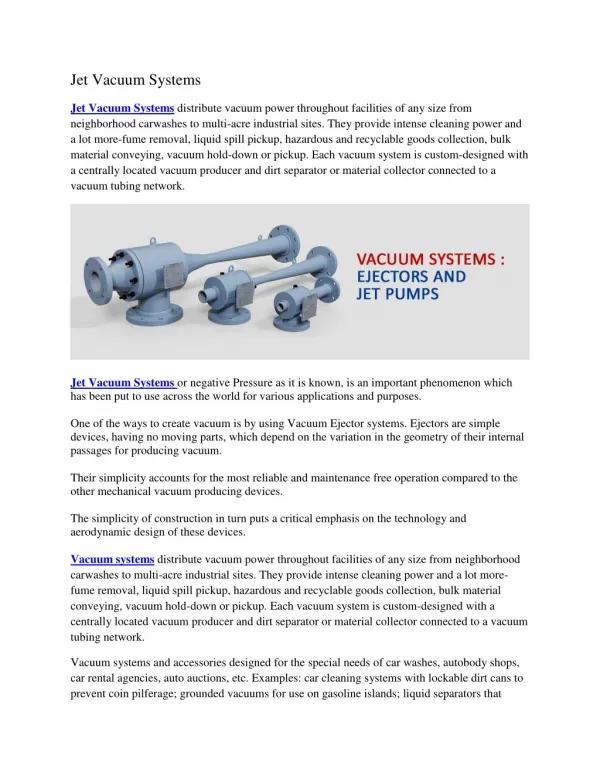
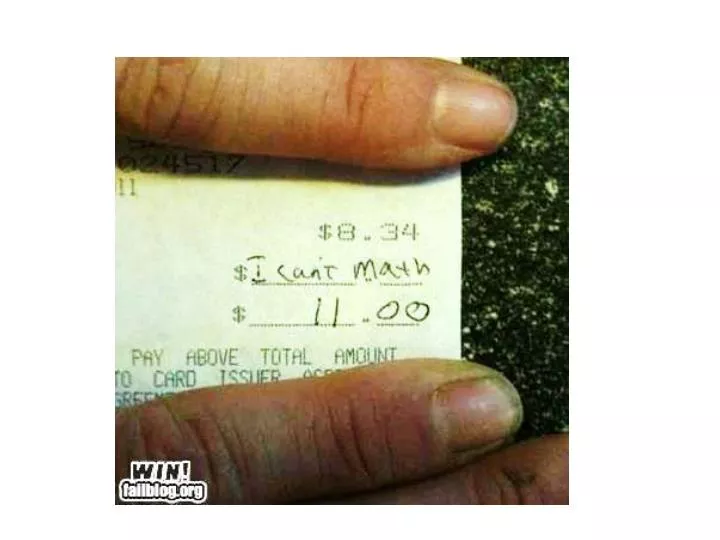
Today’s Safety Zen. Is it safer to use vacuum systems than pressured systems?. vs. Graph Interpretation Problems. Graph vs. picture Slope vs. height Disconnect from data tables. Worst Graphing Ever?. Distinguish misconceptions from errors. Which is bigger?. 1/3 vs. 1/8 2.36 vs. 4.2

E N D
Today’s Safety Zen Is it safer to use vacuum systems than pressured systems? vs.
Graph Interpretation Problems • Graph vs. picture • Slope vs. height • Disconnect from data tables
Which is bigger? • 1/3 vs. 1/8 • 2.36 vs. 4.2 • g vs. mg
Examples of Math Misconceptions • Multiplication always creates bigger numbers. • Multiplication by 10 adds a zero.
Powers of Ten –Gahh! Metrics Dilutions Environmental Science
Statistics:Correlation vs. Causation • Belief: Fluoridated water causes cancer. • Belief: Vaccines cause autism.
If you have 23 people in a room, what is the probability that two of them will have the same birthday? The Birthday Problem
Misunderstanding Probability • Genetics • Health
Which sounds worse? • A woman born today has a 1 in 8 chance of developing breast cancer. • 88% of the women born today will never develop breast cancer.
Mammography Statistics • The probability that a woman has breast cancer is 1%. • If a woman has breast cancer, the probability that she tests positive is 90%. • If a woman does not have breast cancer, the probability that she nevertheless tests positive is 9%. A woman has a positive mammogram. What is her risk of actually having breast cancer? A. Out of 10 women with a positive mammogram, ~9 have breast cancer. B. Out of 10 women with a positive mammogram, ~1 has breast cancer. C. The probability that she has breast cancer is about 1%.
Guidelines for Preventing Math Errors • Keep track of all information (paper trail). • Use visual keys, such as arrows. • Keep track of units. • State answer clearly, WITH UNITS. • Check that your answer makes sense.