Download
1 / 41
430 likes | 495 Vues
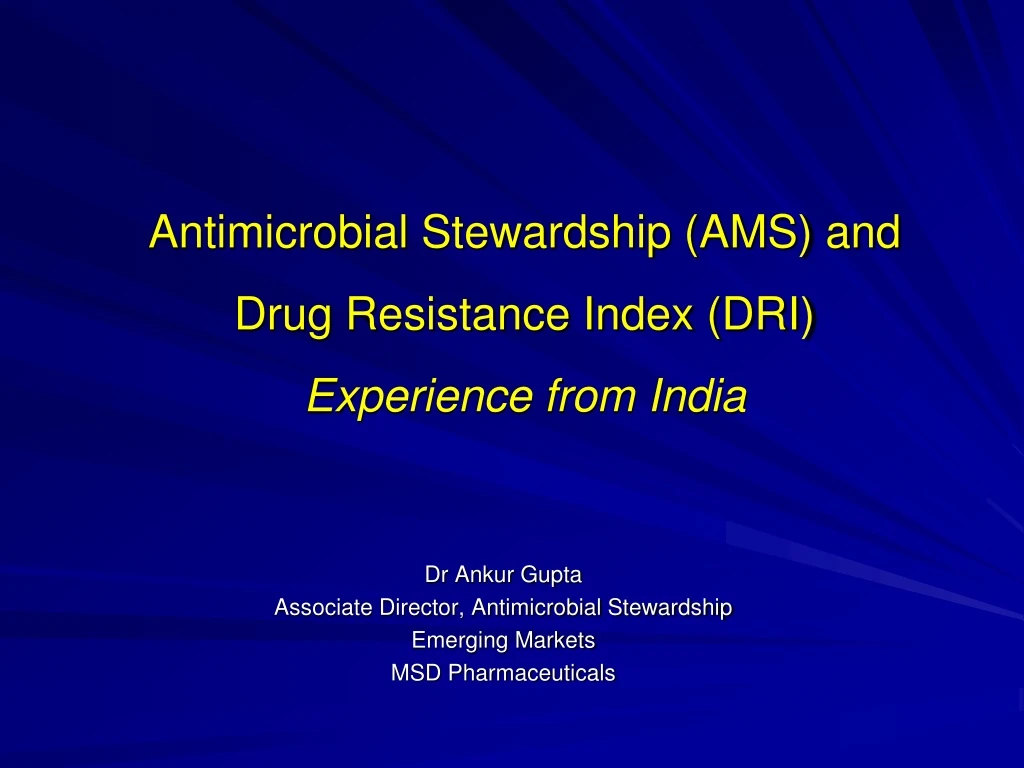
Antimicrobial Stewardship (AMS) and Drug Resistance Index (DRI) Experience from India. Dr Ankur Gupta Associate Director, Antimicrobial Stewardship Emerging Markets MSD Pharmaceuticals. Outline of talk. Experience from India and other countries Measuring Outcomes of AMS implementation

E N D
Antimicrobial Stewardship (AMS) and Drug Resistance Index (DRI)Experience from India Dr Ankur Gupta Associate Director, Antimicrobial Stewardship Emerging Markets MSD Pharmaceuticals
Outline of talk • Experience from India and other countries • Measuring Outcomes of AMS implementation • Drug Resistance Index (DRI)
Implementation barriers for AMS in a hospital Lack of understanding and utilization of Microbiology data by clinicians to make antibiotic decisions Difficulty in measuring adherence to policy and measures outcomes to see impact of AMS Lack of knowledge And consensus on critical issues like MDR management and De-escalation Lack of all resources in a single hospital Eg: ID, Pharm ID, Clinical microbiologist AMS Barriers In hospitals Formulary restriction is Controversial, Pre-authorisation impinges on Physician autonomy Lack of ownership and faith on Antibiotic policy by the end users i.e clinicians
Antimicrobial Stewardship – Customised! Education.(AII) Guidelines and clinical pathways based on local data (AI) Streamlining or de-escalation of therapy.(AII) Prospective audit with intervention and feedback.(AI) To Educate and Promote Evidence basedusage of antibiotics by making Customized treatment protocols based on the hospital’s own Microbiology datawhich can beaudited and reviewed Prospective audit with intervention and feedback. Formulary restriction and preauthorization
Integrates education, Action and Evidence even with limited resources Democratic AMS with clinician ownership Facilitates Management options for MDRs, Pathway For De-escalation THINK GLOBAL – ACT LOCAL Local Microbiology data and Global principles of AMS integrated into one document Clinician friendly format which aids decision making without hurting autonomy Strengths of AMS Model
AMS Update from around the World • Partnership with CDDEP (USA) to measure Drug Resistance Index (DRI) as an outcome measure of AMS implementation • In India, more than 105 protocols (75hospitals) • completed in the last 5 years Agreement with two of the largest Pvt hospital chains in the India – The Fortis and The Apollo (>80 hospitals) for AMS • More than 20 protocols in 40 • hospitals made in Russia. • National AMS guidelines developed • with MSD’s help • 3 protocols to made in 3 hospitals • in Vietnam by 2013 end • AMS rolled in 100 hospitals in • Columbia. To measure outcomes in • 60 hospitals AMS Update 2013 Russia, Columbia, Philippines, Vietnam have started work on AMS. - Golden Peacock Award for AMS to MSD India in ‘Innovative Service’ category - Presentation of MSD AMS Model at ICID in Bangkok
Key Performance Indicators (KPIs) of an AMS programme Structural Indicators Process Indicators Clinical/cost Outcome Indictors
Structure Indicators • Structure Indicators: describe organisation and resources, communication and evaluation tools available at hospital level for implementing a multi-modal, multi-disciplinary stewardship programme • Top 5 Structrural Indicators are: • Hospital multi-disciplinary antibiotic management team (AMT) • Antimicrobial Drug formulary with annual updates • Annual update of local clinical guidelines for empirical therapy based on review of local resistance data • Local clinical guidelines for surgical antibiotic prophylaxis • Clinical guidelines for IV to oral switch Buyle FM etal. Eur J Clin Microbiol Infect Dis (2013) 32:1161-1170 Antibiotic Strategy International (ABS) Quality Indicators Team- EU
Process Indicators • Process measures are direct measures of the quality of antibiotic prescription. Eg:AB therapy and prophylaxis (including choice, timing, dose and duration) adherence to treatment guidelines www.ashpadvantage.com/stewardship American society of health System Pharmacists
Tools for capturing process Indicators a. Point Prevalence or Snapshot Surveys b. Audit and feedback chart surveys • Snap Shot Survey Point prevalence surveys are done at a single site on a single day. The data are often collected from one data source — the medication chart. The type of information provided by these surveys may include the percentage of patients prescribed antimicrobials, the range and volume of agents prescribed, percentage of ‘restricted’ antimicrobials prescribed, number of antimicrobials per patient, duration of therapy, dosing and dosage interval, and time for intravenous-to-oral switching • Audit and Feedback Survey • reviews of drug charts, with antimicrobial prescriptions assessed according to predetermined criteria of appropriateness • chart reviews of treatment of selected infectious diseases, identified by positive microbiological tests • reviews of ‘restricted drugs’ to ensure that proper approval processes have been followed Antimicrobial Stewardship in Australian Hospitals. Jan 2011. Australian commission on safety and quality in healthcare
Data Collection Day 1: ID of Patient Name: Age/Sex UHID no. Date of admission Possible site of infection : lungs/pleura/Genitourinary/Bloodstream/SSI/Intraabdominal/CNS/any other severity of infection BP Lactates paO2/Fio2 ratio Respiratory support Appropriate specimen sent. Sputum, pleural fluid, urine, blood culture, pus, CSF Lab reports: TLC LFT : Bil SGOT SGPT SAP RFT: BUN Creat CXR : U/L or B/L Single zone/ multiple zones/ segmental/lobar PCT Pyuria Antibiotic(s) Administered Drug(s) : Dose Route First dose given within 4 hrs : Yes/NO Data Collection on D 3 ID of Patient Name: Age/Sex UHID no. Date of admission Final site of infection : lungs/pleura/Genitourinary/Bloodstream/SSI/Intraabdominal/CNS/any other Severity of infection BP Lactates paO2/Fio2 ratio Respiratory support Cultures available Pathogen Sensitivity Sputum _________________________________________ pleural fluid_______________________________________ urine____________________________________________ blood culture_______________________________________ Lab Reports TLC LFT : Bil SGOT SGPT SAP RFT: BUN Creat CXR : U/L or B/L Single zone/ multiple zones/ segmental/lobar PCT Pyuria Antibiotic plan- Appropriate Dose Route Duration planned Action taken Cont same/Deescalated/Escalated Example of Audit tool- 3 Day Antibiotic Bundle
Clinical / Cost Outcome Indicators • Clinical Outcomes • Change in resistance patterns outcome • Utilization and Cost outcomes • The best way to showcase the difference in these outcome • measures is to show the Pre-AMS and Post AMS difference
Compliance Audit – Results AMS Works – Evidence from a hospital in India Showing Pre and Post AMS difference Data from KIMS Hospital, Kerala, South India. Courtesy: Dr Anup Warrier (ID physician)
The Drug resistance index (DRI) A novel tool to track the evolution of antibiotic resistance
What is the DRI? • The Drug Resistance Index (DRI) aggregates information about antibiotic resistance and antibiotic use into a single composite measure. • Think of it as a “Dow Jones” for drug resistance • It is an epidemiological and communications tool to convey trends in drug resistance to non-experts: healthcare managers, policymakers, media.
Communicating the antimicrobial resistance to policymakers and non-experts is a challenge It is complicated by the multiplicity of bacterial pathogens and distinct classes of antibiotics used to treat them. It is difficult, even for experts to infer the seriousness of resistance whether alternative antibiotics are available. Difficulty in aggregating resistance to multiple drugs to assess trends poses a further challenge to quantifying and communicating changes in resistance over time and across locations. Why we need DRI ?
Plotting of DRI curve Values show overall resistance, adjusted for the prescribed volume in each period.
Interpretation of DRI value • The DRI value is between 0 and 1 • It is a relative value expressing the overall susceptibility of that species to the basket of antibiotics available to treat it. • It should not be understood as multidrug resistance, but rather the proportion of resistant isolates adjusted for the relative importance (i.e. prescribed volume) of each drug in each period. • A value of 1 means that infections are untreatable with any of the antibiotics used in the given setting. • A value of 0 means all isolates included in the calculation were susceptible. • The strength of any index is that it makes comparisons over both time and location substantially easier. • For example, an increase in the DRI of Pseudomonas from 0.56 to 0.6 in the next month tells you that that infection has become more difficult to treat, taking into account any changes in prescribing patterns towards more effective antibiotics. • .
Where can the DRI be used? • The DRI can be calculated any any level for which there is data: • Ward • Hospital • Hospital network • Healthcare region • National level • DRI exceptionally useful at the facility level, where it can directly aids the implementation of antimicrobial stewardship.
What’s the utility of the DRI? • Clinicians and antimicrobial stewards: • Summarize trends for epidemiological reporting • Measure overall effect of prescribing interventions on resistance • Utilize routinely generated data more efficiently • Administrators and policymakers: • Benchmark performance against other DRI adopters to guide resource allocation for stewardship or improvements in infection control. • Aggregate at national/regional level to illustrate dearth of new drugs and call for policy action.
DRI can be measured at facility level of ward level to measaure the performance of stewardship efforts Two ingredients to calculate DRI are Consumption of antibiotic data from pharmacy Antibiogram from the microbiologists DRI is measured in 3 simple steps Preparing resistance data (antibiogram) Preparing utilisation data (antibiotic consumption) Collating information and calculating DRI Raw materials to calculate DRI
Step 2: Preparing Utilization data (consumption) Use (Consumption) = DDD / BD × 100 DDD (Defined Daily Dose) = Total Antibiotic consumption (gm) / Total Adult Daily Dose (gm) BD (Bed Days) = 365 (for 1 yr) × Total beds in hospital × Occupancy Index
Step 3: Calculating DRI Use weight = Proportion of a drug used over combined usage of all drugs Weighted resistance = Resistance rate × Use weight Index Value = Sum of Weighted resistace
DRI can become an extended arm of Antimicrobial Stewardship (AMS) DRI has the potential to become an effective outcome measure to assess the impact of AMS implementation on change in antimicrobial resistance DRI can change the outlook of hospital owners and healthcare professionals towards antibiotic resistance. DRI can potentially become a marketing tool for hospitals to advertise their infection control and effort on curbing antimicrobial resistance as compared to competitors DRI – Tool for AMS and Infection control in Hospital
To adopt and own AMS and DRI as signature campaigns by Merck / MSD across AP region / emerging markets for countering antimicrobial resistance To create think tank of KOLs across these regions with strong endorsement for DRI as a tool to measure and track antimicrobial resistance To influence the health authorities of repute in the world to validate and include DRI as a surrogate tool to measure and track antimicrobial resistance What we hope to do with DRI