Download
1 / 34
340 likes | 501 Vues
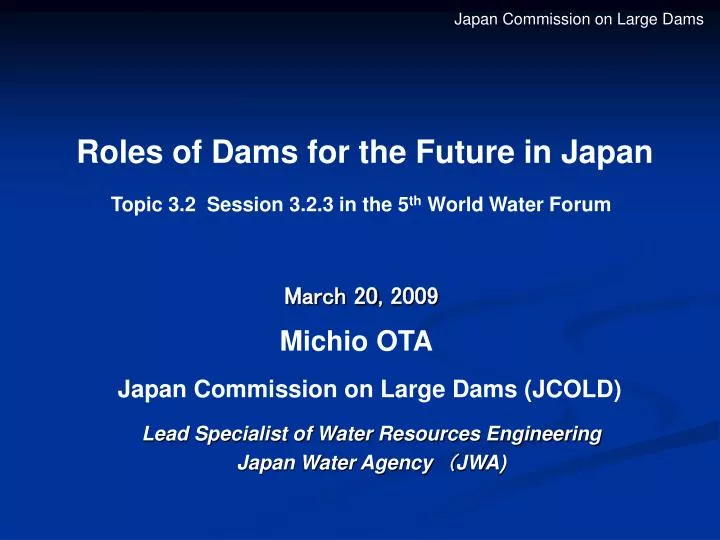
Japan Commission on Large Dams. Roles of Dams for the Future in Japan. Topic 3.2 Session 3.2.3 in the 5 th World Water Forum. March 20, 2009. Michio OTA. Japan Commission on Large Dams (JCOLD). Lead Specialist of Water Resources Engineering Japan Water Agency ( JWA). Contents.

E N D
Japan Commission on Large Dams Roles of Dams for the Future in Japan Topic 3.2 Session 3.2.3 in the 5th World Water Forum March 20, 2009 Michio OTA Japan Commission on Large Dams (JCOLD) Lead Specialist of Water Resources Engineering Japan Water Agency (JWA)
Contents • Condition of Water Affairs in Japan 2. Roles of Dams up to the present in Japan 3. Roles of Dams for the Future in Japan 4. Roles of Dams for the Future in the World with regard to Food Security
Contents • Condition of Water Affairs in Japan
Precipitation Temp. Tokyo (mm) (℃) 30 400 20 300 10 200 0 100 -10 0 1 2 3 4 5 6 7 8 9 10 11 12 Rivers and Precipitation in Japan Annual mean rainfall: 1,700mm Source: Ministry of Land, Infrastructure, Transport and Tourism, MLIT
Rivers in Continents Comparison of Riverbed Gradients Elevation (m) Rivers in Japan Distance from river mouse (km) Source: MLIT
Feature of Rivers in Japan is, - huge difference in the condition between flooding time and normal time - the water flow out soon after the flooding time Tone River Yodo River Kiso River Mississippi River Danube River Thems River Source:MLIT, Annual Report of Flow Rate(1984~1993)
Tokyo after the war in 1945 Source: Prof. Tuneaki Yoshida, Tokyo Univercity 7
Tokyo in 2008 Source: http://bluestyle.livedoor.biz/
Periods according to the Change of Economic Condition GDP (Trillion YEN) 600 Pop. (Million) 14 500 140 DGP growth rate (%) 12 Population 120 400 10 100 8 GDP 300 6 80 4 60 200 2 40 100 0 20 -2 0 0 9 1950 1960 1970 1980 1990 2000 Source: MLIT
Serious Water Shortage in Metropolitan Area Supply trough Water Tank Truck
Pollution in Urban River Smelled badly and no fish In 1960s to early 1970s 11
Guidelines for Ground Subsidence Prevention established for Chikugo and Saga Plains and Nobi Plain Guidelines for Measures to Prevent Ground Subsidence, etc. established for northern Kanto Plain Industrial Water law is revised and Building Water Law is enacted Basic Law for Environmental Pollution is enacted Digging of deep wells begins in various locations Ground subsidence is confirmed Industrial Water Law is enacted Cumulative ground subsidence (cm) 0 Minamiuonuma (Yokawa, Muika Town, Niigata Prefecture) -50 -100 Chikugo / Saga Plains (Yokote, Shiroishi Town, Saga Prefecture) Kanto Plain (Higashiowa, Washinomiya Town, Saitama Prefecture ) -150 Nobi Plain (Hakke, Nagashima Town, Mie Prefecture) Niigata Plain (Sakai, Niigata City, Niigata Prefecture) -200 Osaka Plain (Hyakushima, Nishiyodogawa Ward, Osaka) -250 -300 -350 -400 Kanto Plain (Kameido, Koto Ward, Tokyo) -450 -500 1910 1900 1920 1930 1940 1950 1960 1970 1980 1990 2000 1890 Changes Over Time in Ground Subsidence GL 0 m Source: http://www.ara.go.jp/arage/keisei/keisei02.html 1970 4.5m
Flood Disaster Tokyo area hit by Kathleen Typhoon in 1947 Source: MLIT
12 Flood Disaster Inomori-cho, Tenpaku-ku, Nagoya city in 2000 Normal condition Struck by the disaster “Source: MLIT
Contents 2. Roles of Dams up to the present in Japan
Agricultural Water Manno-Ike Pond: Presented by Manno-Ike Land Improvement District Change of Farm Land Area and Population In Japan Source: National Land Agency
Agricultural Water Percentage of Active Storage Capacity of Irrigation Ponds and Dams in Japan (a supply area of 2 ha or more) Total Active Capacity: 2,999,712×103 m3 Total Supply Area: 1,225,882 ha 10% Number of Ponds and Dams:63,591 24% 9% 47% 3% 7% Source: Ministry of Agriculture, Forestry and Fisheries, MAFF
Transition of Water Supplied Population and Average Life Expectancy 18 Domestic Water Water supplied population Average life expectancy (years) Average life expectancy Water supplied population (ten thousands) Water utilization capacity of dam (hundred thousands m3) Dam water utilization capability of the water supply 1970 1950 1990 1960 1940 1995 1980 1883 1890 1910 1930 1920 1900 Source: MLIT
Energy for Water Changes of Electric Power Production at the Early Stage Source: Electric Power Civil Engineering Association
Energy for Water Comparison of Electric Power Source
Flood Control Flood Control: Mitigation of Flood Disasters in Japan 21
Japan has around 2,800 dams which heights are over 15m. Dams have played a critical role for Japanese socioeconomic development based on increase of food production, supply of electric power, development of water for domestic and industrial use and improvement of safety level of flood control especially in large cities.
Contents 3. Roles of Dams for the Future in Japan
Variability of extreme events is increasing due to climate change Source: MLIT Climate Change In Japan Annual Precipitation Variability Average rainfall trend
legend less than 1cm from 1cm to less than 5cm from 5cm to less than 10cm from 10cm to less than 20cm from 20cm to less than 50cm from 50cm to less than 100cm from 100cm to less than 150cm 150cm and more legend less than 1cm from 1cm to less than 5cm from 5cm to less than 10cm from 10cm to less than 20cm from 20cm to less than 50cm from 50cm to less than 100cm from 100cm to less than 150cm 150cm and more Estimation of the snow depth at 100 years from now • Because of the global warming, at 100 years from now, it is predicted that there will be almost no snow in West Japan • At the Sea of Japan side, it is predicted that the area which has the greatest snow depth of 100cm or more will be narrowed drastically Distribution map of greatest snow depth in cooling season Present 100 years later Climate Change Source: “Estimation of change of snow under global environmental change” Inoue Satoshi, Yokohama Kotaro, National Institute for Agro-Environmental Sciences 4
Population Projections for Japan: 2006-2055 Source: National Institute of Population and Social Security Research in Japan
Virtual Water • Japan indirectly uses other countries’ water resources through the import of foods etc • The trend in trade will also have impact on the future water demand and supply in Japan Japan’s total import amount of virtual water Others Virtual water poured in Japan by import item (billion m3/year ) Corn Soybean Wheat Rice Barley Beef Pork Chicken Milk and dairy products Industrial products Self-sufficiency rate in food is 40% Total import amount: 64 billion m3/year > Japan’s domestic consumption of irrigation water: 59 billion m3/year Source: Calculation of the research group of Oki assistance professor at Institute of Industrial Science, University of Tokyo, based on the demand and supply of foods etc. 7
Contents 4. Roles of Dams for the Future in the World with regard to Food Security
Predictions of the future world population and grain production Source: Water Resources Dept. MLIT
Conclusion • 1. Secure Food Production in Japan • Japan should increase more food production domestically • and ensure stable supplies of food in the future. • A stable supply of irrigation water must be ensured by • storing unstable river flow with irrigation ponds and dams. • Water for Energy in Japan • Japan should have a policy to restrict emission of CO2. • Hydropower is a clean and 100% domestically produced • recyclable energy in Japan. • Dams for hydropower generation will contribute to the above.
Conclusion 3. Climate Change Adaptation in the view of Dams in Japan Abnormal phenomena of heavy rain and serious drought et al. will be caused by global warming and make a greater impact on water supply in the future. Using Dams is one of the effective climate change adaptations. However, new dams will not being smoothly constructed in Japan, thus the burden on existing dams will continue to rise. The priority issues are redeveloping existing dams and reorganizing of existing dams to optimize their operations.
Conclusion 4. Roles of Dams for the Future in the World with regard to Food Security Need of world grain production in the near future will increase demand for agricultural water. Further expansion of cultivated land and improvement of deteriorated farmland including overgrazing of grassland, land of salt accumulation caused by excessive pumping of grand water and so must be done especially in developing countries. These factors will increase the need for development of new water resources to supply irrigation water.
Thank you for your kind attention Photo: Environment Bureau, Tokyo Metropolitan Government Tama River around 1970