Download
1 / 1
20 likes | 160 Vues
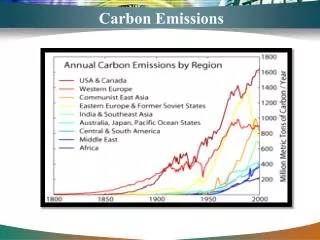
How to access global and regional burnt biomass from satellite observations to derive gases and particle emission inventories? C. Liousse, C. Junker, J.M. Grégoire, C. Granier, A. Mieville, A. Konaré and B. Guillaume. Introduction. Example of differences between BB inventories.

E N D
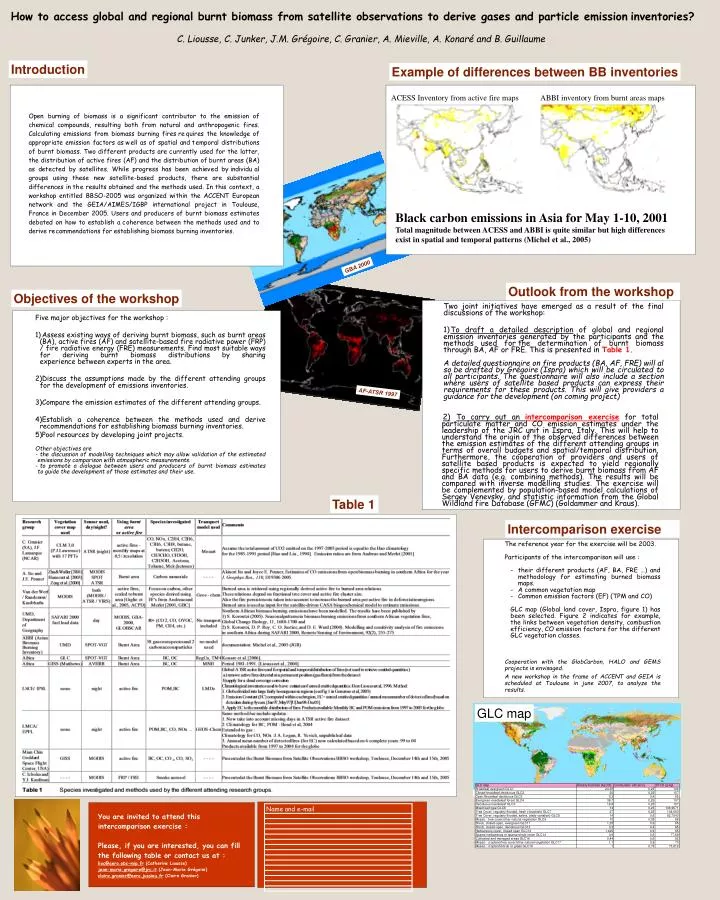
How to access global and regional burnt biomass from satellite observations to derive gases and particle emissioninventories? C. Liousse, C. Junker, J.M. Grégoire, C. Granier, A. Mieville, A. Konaré and B. Guillaume Introduction Example of differences between BB inventories ACESS Inventory from active fire maps ABBI inventory from burnt areas maps Black carbon emissions in Asia for May 1-10, 2001 Total magnitude between ACESS and ABBI is quite similar but high differences exist in spatial and temporal patterns (Michel et al., 2005) GBA 2000 Outlook from the workshop Objectives of the workshop AF-ATSR 1997 Table 1 Intercomparison exercise GLC map