Download
1 / 35
350 likes | 457 Vues
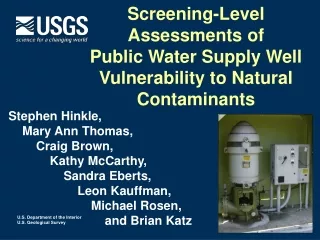
Delineation of Ground water Vulnerability to Agricultural Contaminants using Neuro-fuzzy Techniques. Barnali Dixon 1 , H. D. Scott 2 , J. V. Brahana 2 , A. Mauromoustakos 2 , J. C. Dixon 2. 1 University of South Florida, 2 University of Arkansas. Introduction.

E N D
Delineation of Ground water Vulnerability to Agricultural Contaminants using Neuro-fuzzy Techniques Barnali Dixon1, H. D. Scott2, J. V. Brahana2, A. Mauromoustakos2, J. C. Dixon2 1 University of South Florida, 2 University of Arkansas
Introduction • Delineation of vulnerable areas and selective applications of animal wastes/fertilizer in those areas can minimize contamination of ground water (GW). • However, assessment of GW vulnerability or delineation of the monitoring zones is not easy since uncertainty is inherent in all methods of assessing GW vulnerability
Sources of Uncertainties • Errors in obtaining data • The natural spatial and temporal variability of the hydrogeologic parameters in the field • The numerical approximation and computerization
Characteristics of the Models • Capability to deal with uncertainties • Tolerate imprecision • Extract information from incomplete data sets • Incorporate expert’s opinion directly into the model • Regional Scale • The models use existing data bases • Integrated in a GIS
Specific Objectives • Integrate the Neuro-fuzzy techniques in a GIS platform to predict ground water vulnerability in a large watershed
Primary Data Layers Used • Watershed Boundaries • Location of springs/wells • Water quality • Geology • Soils • Landuse and landcover (LULC)* • DEMs * model inputs
Secondary Data Layers Used • Soil hydrologic group* • Soil structure (pedality points)* • Depth of the soil profile* (excluding Cr and R) • Slopes • Elevation * model inputs
Description of the Input Data Layers Data Scale/resolution Comments
Spatial Distribution of Soil Structure (Pedality Points) Low = 14 – 17, Moderate = 20 – 30, Moderately high= 31 – 40, High = 40 – 50 and very high> 51
Spatial Distribution of Soil Profile Depth Depth (inches) : Shallow = 9 – 30, Moderately shallow = 31 – 50, Moderately deep = 51 – 69, Deep = 70 – 85 and Very Deep = > 85
Necessary steps • Training data • Testing data
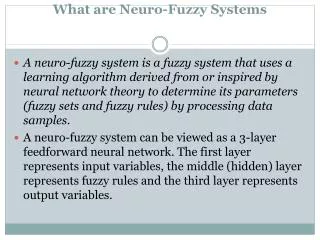
Why hybrid? • Schultz and Wieland (1997) suggested that NN could parsimoniously represent non-linear systems and seem to be robust and flexible under data driven situations and allow deeper professional insight into the model. • Fuzzy logic provides an opportunity to incorporate experts’ opinion and robust under uncertainty.
Assessment of Models • Comparison of models and Field data • Coincidence analyses • Coincidence with inputs
Spatial Distribution of Vulnerability from the Preliminary Neuro-Fuzzy
35,000 30,000 Non Classified (0) 25,000 High ( 1) Moderately high (2) Moderate (3) Area (ha) 20,000 Low (4) 15,000 10,000 5,000 0 Agriculture Urban Shrubs and Forest Water Confined Brush Animal Operation Landuse Categories Landuse vs. Vulnerability Categories
Soil Structure (Pedality Points) vs. Vulnerability Categories
Spatial Distribution of Wells with Nitrate-N Contamination Level
Summary • Soils with high water transmitting capacity, hydrologic group C, deep soil horizon coincided with highly vulnerable areas • Soils with moderately high water transmitting capacity, hydrologic group C, deep soil horizon coincided with moderate vulnerability • Soils with low water transmitting capacity, hydrologic group B, deep soil horizon coincided with low vulnerability category
Summary cont... • Majority of the soils with high vulnerability coincides with agriculture • Incorporation of landuse in the model need to be fine tuned i.e. potential use of agricultural inputs should be accounted for • Use of the Neuro-fuzzy techniques saved time required to develop the preliminary model • Further modification and fine tuning needed