Download
1 / 33
330 likes | 433 Vues
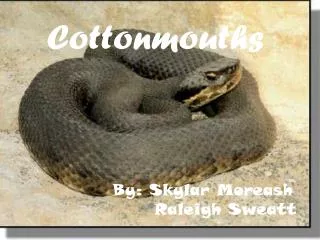
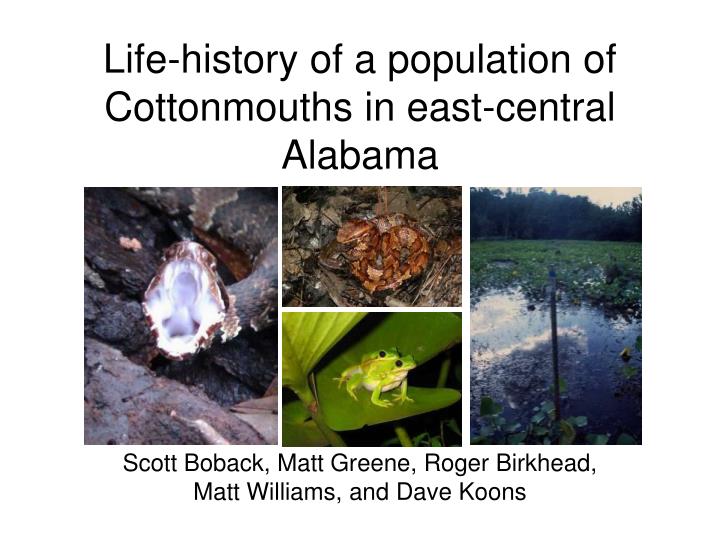
Life-history of a population of Cottonmouths in east-central Alabama. Scott Boback, Matt Greene, Roger Birkhead, Matt Williams, and Dave Koons. How do organisms respond to environmental variation?.

E N D
Life-history of a population of Cottonmouths in east-central Alabama Scott Boback, Matt Greene, Roger Birkhead, Matt Williams, and Dave Koons
Comparative life-history can help us understand how organisms respond to variation in the environment.
A. p. piscivorus A. p. leucostoma A. p. conanti
Four years of sampling every two weeks 391 captures of 198 individuals 49% adults Results
67.9 62.6 Body Size 10 5 0 5 Number of Snakes 10 15 Males 20 Females 25 30 30 40 50 60 70 80 90 SVL (cm)
336.8 277.0 Body Size 10 5 0 5 Number of Snakes 10 15 20 Males Females 25 30 0 100 200 300 400 500 600 700 Body Mass (g)
Body Size 80 75 70 67.9 Mean Male SVL (cm) 65 60 55 50 AR VA NC AL SC AR
Sexual Size Dimorphism Equal -0.92 -0.9 SSD Index -0.8 -0.7 -0.6 FL AR NC VA VA AR SC AL
29 67 35 95 69 38 41 21 Sex Ratio March – June 15 7 June 16 – October 6 5 4 Sex Ratio (F:M) 3 2 1:1 Sex Ratio 1 0 2001 2002 2003 2004
Survival Analysis- MARK • Cormack-Jolly-Seber estimator for open populations • Survival = probability that a snake alive in week i survived and did not permanently emigrate from study area in week i+1 • Recapture = probability that a marked snake alive in week i did not permanently emigrate and was captured in week i+1
Recapture Probabilities Recapture probability higher in first year Strong effect of transient individuals Weekly Recapture Probability Annual survival = 0.79 SVL (cm)
Reproduction • Litter size = 4.1±1.5 (N=11) • RCM = 26.2±9.3 (N=7) • Frequency of pregnancy from 91% - 15%
Litter Size 8 7 6 Mean Litter Size 5 4.1 4 3 2 AL AR TX TX FL SC FL NC VA VA
Growth – Field Data 3 Males Females 2 Growth Rate (cm/month) 1 0 -1 30 40 50 60 70 80 90 Midpoint SVL (cm)
10 8 6 4 2 0 -2 20 30 40 50 60 70 80 90 100 Growth – Lab Data Males Females Growth Rate (cm/month) Midpoint SVL (cm)
Growth – Field versus Lab 10 Field Lab 8 6 Growth Rate (cm/month) 4 2 0 -2 20 30 40 50 60 70 80 90 100 Midpoint SVL (cm)
Polyphasic Growth 100 80 60 SVL (cm) 40 20 A S O N D J F M A M J J A S O N D J F M A M J J A S O N D 2001 2002 2003
Summary • High annual survival • Likely a long-lived species • Frequency of reproduction highly variable • Small litter size • Slow growth but capable of extremely rapid growth when resources are abundant