Download
1 / 25
250 likes | 383 Vues
What I Learned in 8 th Grade Math. My personal review capstone project. Personal Review Capstone Project Instructions:. Look on my website for the Release STAAR Test . I have also attached all the questions for the project at the end of the PowerPoint.

E N D
What I Learned in 8th Grade Math My personal review capstone project
Personal Review Capstone Project Instructions: • Look on my website for the Release STAAR Test. I have also attached all the questions for the project at the end of the PowerPoint. • You may choose any media you’d like. • Your project must be at least 12 slides or sections; one for each Big Idea and one for the title page. • Solve the indicated problems. • Instructions Part 1: Work out the problems. Give the answers you come up with. • Instructions Part 2: Create a similar problem, do not copy it. Work it out as if you are teaching someone else who doesn’t understand it yet. What are the tricky points? Where could careless mistakes or common errors be made? How do you know it is right? Is there a different way to solve it? How did you check for reasonableness? • Make it personal. Do your best. Save it and show it to your kids when they are in the 8th grade.
Big Idea #1Convert and Order NumbersI understand that different forms of numbers are appropriate for different situations. I know how to compare and order rational numbers in various forms including integers, percents, and positive and negative fractions and decimals • Released STAAR questions 8, 30 • Instructions Part 1: Work out the problems. Give the answers you come up with. • Instructions Part 2: Create a similar problem, do not copy it. Work it out as if you are teaching someone else who doesn’t understand it yet. What are the tricky points? Where could careless mistakes or common errors be made? How do you know it is right? Is there a different way to solve it? How did you check for reasonableness?
Big Idea #2Word ProblemsI can use appropriate operations to solve problems involving rational numbers in problem situations • Released STAAR questions 15, 27 • Things to remember: • Watch out for careless mistakes by checking your work and solving it in more than one way. • Round numbers to whole numbers and estimate to check for reasonableness • Line up decimals when adding and subtracting • Count decimal places when multiplying • Move the decimals to the right when dividing if necessary
Big Idea #3Percents and RatesI can estimate and find solutions to application problems involving percents and other proportional relationships such as similarity and rates • Released STAAR questions 12, 34 • Things to remember: • Is/of = %/100 • At least 4 ways to set up a proportion • Unit rates are powerful. Find out the value of one and multiply it by how ever many you need
Big Idea #4MARS(Multiple Algebraic Representations)I can make connections among various representations of a numerical relationship. I can generate a different representation of data given another representation of data (such as a table, graph, equation, or verbal description) • Released STAAR questions 18, 26 • Things to remember: • Y=.0825x+x • If x represented the cost of something and the tax rate is 8.25%, what would Y represent? • Y=-5x+160 • Verbal: you have $160 and will spend $5 per week. • Y=how much money you have, X=the week number • Plug in a value for the week and solve for y. These ordered pairs are solutions to the equation that make the table. • Is this proportional or non-proportional?
Big Idea #5Using MARS(Multiple Algebraic Representations) I can predict, find, and justify solutions to application problems using appropriate tables, graphs, and algebraic equations; • Released STAAR questions 1, 24
Big Idea #6Similar FiguresI can generate similar figures using dilations including enlargements and reductions • Released STAAR questions 9, 32 • Things to remember: • Scale Factors bigger than 1 enlarge. • Scale Factors less than 1 and greater than 0 reduce. • Scale factors can be represented by a fraction, decimal or percent. • SF: new/old
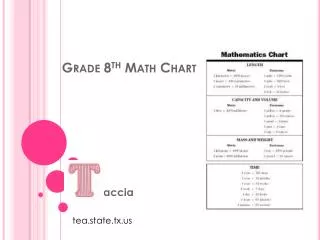
Big Idea #7Surface Area and VolumeI can estimate measurements and use formulas to solve application problems involving lateral and total surface area and volume • Released STAAR questions 11, 33 • Things to remember: Formulas are friends. • B= Area of the base • P= Perimeter of the base • Shade and trace the base • Formula, plug-in, evaluate, check for reasonableness
Big Idea #8Pythagorean TheoremI can use the Pythagorean Theorem to solve real-life problems • Released STAAR questions 7, 23 • Things to remember: • a^2+b^2=c^2 • Hypotenuse is the longest side • Works only with right triangles • If a is the side length, a^2 is the area of the side squared
Big Idea #9Find missing measurementsI can use proportional relationships in similar two-dimensional figures or similar three-dimensional figures to find missing measurements • Released STAAR questions 2, 37 • Things to remember: • Set up a proportion • Find scale factor: new divided by old corresponding side lengths • Multiply to apply the scale factor
Big Idea #10ProbabilityI can find the probabilities of dependent and independent events • Released STAAR questions 6, 20 • Things to remember: Each event gets its own fraction. The numerator is how many of what you want there are. The denominator is how many total things there are. • Independent: one event does not effect the next events. (tossing a coin, spinners, pulling out a color tile and putting it back) • Dependent: one event DOES effect the next events. The denominator gets smaller. Pulling out something and not replacing it. • Dependent duplicate events: pulling out a King from a deck, keeping it out and pulling out another King: (4/52)(3/51) Assume you got what you wanted on the first pull.
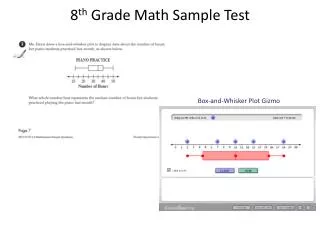
Big Idea #11Tricky GraphsI can recognize misuses of graphical or numerical information and evaluate predictions and conclusions based on data analysis • Released STAAR questions 16, 29 • Things to remember: • Read the title and axis • What is the story of the graph? • Where did the data come from? • Can it be trusted? • Is the sample enough to predict? • If 20% of the class likes chocolate ice cream does that mean 1/5 of the world likes chocolate ice cream?