Download
1 / 43
430 likes | 594 Vues
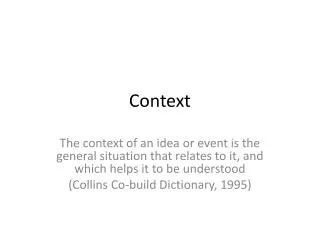
Context. I. BACKGROUND & CULTURE II. RESOURCES. I. Background & Culture. Link. Link. Culture. Hofstede “Cultural Dimensions” Theory . People’s behavior determined by: Human Nature - Universal Personality - Individual Culture - Local View of the world Habits of action

E N D
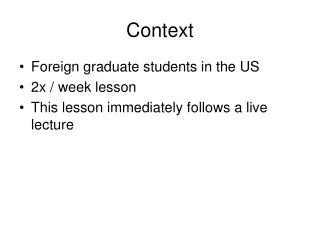
Context I. BACKGROUND & CULTUREII. RESOURCES
Culture Hofstede “Cultural Dimensions” Theory People’s behavior determined by: • Human Nature - Universal • Personality - Individual • Culture - Local • View of the world • Habits of action • Emotional response Assess by measuring values through surveys
Care with National Culture • Avoid stereotypes – Whatever the truth of national cultural tendencies, individual character and human nature important too. • Avoid lazy thinking – Culture imperfectly understood, tempting to attribute everything not understood to cultural differences.
World Values Survey • WVS conducts international surveys to discover attitudes and values at country level. Link to Example Questionaire Ex. Link
Factor Analysis • Many questions will be answered in similar ways across questionaires. (i.e. people who answer “Mentioned” to V13 will answer “Mentioned” to V18, etc.) • Statistical Theory: There are a small number of independent factors which determine systematic correlations in answers to multiple questions. (plants/chlorophyll) . • Use statistics to construct clusters of questions and related answers which can be predicted by these factors. • Use theory to interpret the dimensions
Cultural Values have two dimensions1. Traditional vs. Secular2. Survival vs. Lifestyle Link
Show that factors are associated with identifiable social outcomes. Link
Theory of National Culture Common Cultural Issues Inkeles & Levinson, 1954 Used to form theoretical foundation of factors for internal IBM study of values of employees in many countries. Additional work develops additional dimensions. • Relationship to Authority • Conception of Self • Relationship of Individual to Society • Conception of Masculinity and Femininity • Modes of Conflict Resolution
Cultural Dimensions Theory • Business researchers more likely to use Hofstede “Cultural Dimensions” which looks at 5 dimensions of national culture. • Power Distance (PDI)- Society’s comfort with inequality or preference for hierarchy. • Individualism versus Collectivism (IDV) Preference for Self-sufficiency vs. Group loyalties.
Cont. • Masculinity versus Femininity (MAS) Value of Assertiveness vs. Nurturing. • Uncertainty Avoidance (UAI) s ‘threatened by uncertainty and ambiguity and try to avoid these situations’ • Long-Term Orientation (LTO)Present vs. Future Link
Culture and Business Potential for Competitive Advantages • Implications for Human Resources Management. • Implications for Marketing • Implications for Accounting
Setting Job Targets Link Nordic Masculinity vs. Femininity France, Italy US,UK High Power Distance vs. Low Power Distance
Assessment & Management Link Latin America Individualism Vs. Collective US,UK High Power Distance vs. Low Power Distance
Culture and Branding Link Successful Brands associations: • In high PDI cultures, “Prestige,”; • in high UA cultures, “Trustworthy,”; • Individualistic cultures: brands associate with abstract concepts, individual products emphasized. • Collectivist cultures: brands associate with concrete people, corporate identities emphasize.
Cultural Values and Accounting Systems Accounting Values S.J. Gray, 1988, Towards a Theory of Cultural Influence on the Development of Accounting Systems Internationally • PRO: Professionalism vs. Statutory Control: Judgement vs. Legal control. • UNI: Uniformity vs. Flexibility • CON: Conservatism vs. Optimism- Prudence • SEC: Secrecy vs. Transparency. Link
II. Resources • Natural Resources • Human Resources • Infrastructure • Technology
A. Natural Resources Income from resource extraction can technically lead to higher GDP per hour…..
Oil Reserves Link to BP Statistical Review of World Energy 2012
Resource Curse • Some scholars argue that countries “blessed” with large endowment of mineral resources suffer slow growth. • Creates social conflict over control of natural resources. • Leads to unaccountable government. • Ex 1. Conflict Diamonds Link
Ex. 2 Nauru (pop. 8000) Link Significant deposits of phosphates and small population made this one of the wealthiest societies in world in 1970’s. But phosphates ran out.. • Country never developed internal sources of productivity unemployment rate 90% • National gov’t corrupt and wasteful, bankrupt and completely dependent on multinational aid
Is the resource curse true? • Recent studies question these results, but findings suggest that positive productivity spillovers to non-resource industries are questionable. (Link Requires registration)
B. Human Capital • Measures skill, education level of the work force. • General (broad primary & secondary education & health) or specific skills (technical skills obtained at tertiary level).
By 2005, average in 25-29 cohort was 12.2 yrs compared with 13.4 years in USA http://www.barrolee.com/
Education • Literacy Rates: WDI • Years of Education Barro-Lee Dataset Link • Quality of Education: OECD Programme for International Student Assessment (PISA) LinkSummary Data
Link Population by age, sex and urban/rural residence Aging Population Structure
Birth rate Natural increase Death rate Time Note: Natural increase is produced from the excess of births over deaths. The Classic Demographic TransitionModel Link Stage 1 Stage 2 Stage 3 Stage 4
Stages of Demographic Transition • Low Population Growth. High Birth Rates, High Death Rates • Population Growth Explosion. Medical Advances slow mortality rates, high population growth. • Slowing Population Growth. Educational Advances slow birth rates. • Low Population Growth. Low Birth Rates, Low Death Rates
World Population Prospects, the 2010 Revision Volume II – Demographic Profiles Link Japan
Fertility Rates • Age-specific fertility rate: Number of Births to women of a specific age per women of that age. • Total Fertility Rates: Sum of Age-specific fertility rates from 15-49 • Longer-term ratio of average number of children • Replacement Ratio: • 2.1 Developed Economy, • 2.3 Developing Economy
C. Infrastructure http://data.worldbank.org/data-catalog/world-development-indicators
http://data.worldbank.org/data-catalog/world-development-indicatorshttp://data.worldbank.org/data-catalog/world-development-indicators
Capacity for scientific advance measurable along a number of dimensions. UNESCO Data D. Technology Capacity Link
Technical Workforce Link
http://www.uspto.gov/web/offices/ac/ido/oeip/taf/reports.htm