Download
1 / 10
100 likes | 282 Vues
LTRA Data Collection and Analysis Process. Data Collection Process. ERO-LTRA2008.xls workbook is sent as an attachment to the Data Request letter Workbook is to be filled out by regions and subregions Data submissions due to NERC by March 31 Notification of data corrections by April 16

E N D
Data Collection Process • ERO-LTRA2008.xls workbook is sent as an attachment to the Data Request letter • Workbook is to be filled out by regions and subregions • Data submissions due to NERC by March 31 • Notification of data corrections by April 16 • Corrected submissions due by April 30
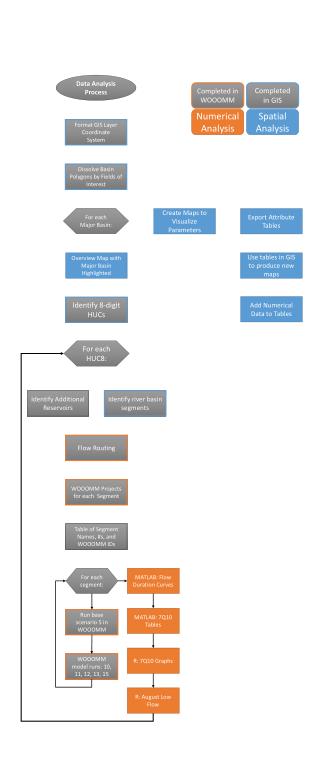
Data Collection Process • Workbooks are copied to server folder and renamed • Data is extracted from workbooks and imported into an Access database • Data is queried and exported to Excel • Tables and charts are inserted into a draft LTRA report
LTRA Data Collection Timeline NERCData RequestLetter Regional Managersand Data Coordinators February 6 7+ weeks NERCTechnicalAnalyst RegionalData Submissions March 31 2 weeks RegionalData Coordinators Data Corrections April 16 2 weeks NERCTechnicalAnalyst Corrected DataSubmissions April 30 6 weeks RAS June 3 Draft Report Analysis, Charts and Tables
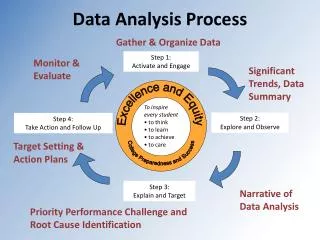
Data Analysis Process • Tables and Charts • Compare to previous year’s data • Identify trend differences • Flag and follow up on outliers • Review demand and capacity projections • Check for consistency with the self-assessment text • Review capacity margin trends • Identify when curves drop below target • Check for consistency with the self-assessment text
NERC/EIA Data Interface KEY NERC = North American Reliability Corporation EIA = Energy Information Administration ES&D = Electricity Supply & Demand database & Unified Generator Database 860 = Annual Electric Generator Report (US only) 411 = Long-Term Generation & Supply Data (US Only) LTRA = Long-Term Reliability Assessment Data Collection (Contains 411 Data) CA/MXGenerator Data All Data NERC EIA ES&D 411 Data 860 Data
Data Analysis Process • Additional Data Queries • Support emerging issues • Identify industry trends • Ad-hoc
Other Data Activities • Electricity Supply and Demand (ES&D) • LTRA data exported to Excel • Includes historic capacity and demand data since 1990 • Contains EIA-860 – Generator data • Available for purchase • NERC members - FREE • Regional Council members - FREE • Government agencies - FREE • Educational Institutions - FREE • Provide support
Problems • Lack of Consistency • Data and definition revisions • Output to tables and charts • Year to year comparison are cumbersome • Supporting questions and teaching the world • No IT Support • VBA hack
DCWG Support • Process Improvement • Helpful tools or applications? • Any suggestions?