Download
1 / 67
670 likes | 831 Vues
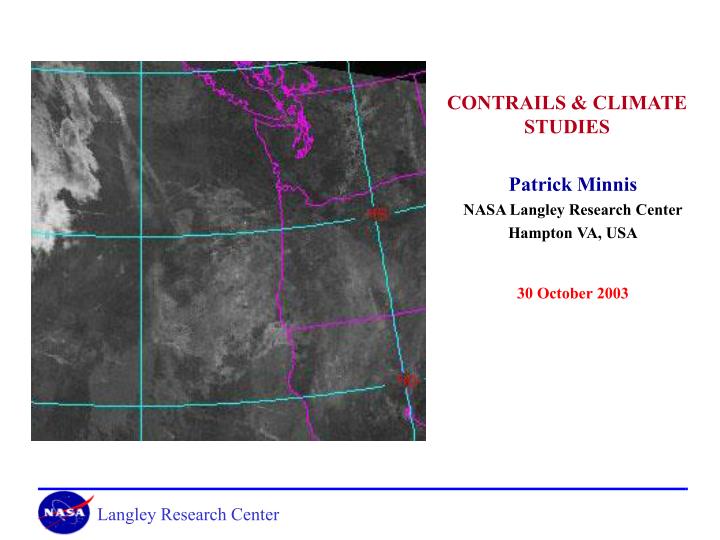
CONTRAILS & CLIMATE STUDIES. Patrick Minnis NASA Langley Research Center Hampton VA, USA 30 October 2003. MOTIVATION. • Air traffic increasing 2 - 5%/year over the globe • Ice supersaturation exists 10-20% of the time at flight altitude

E N D
CONTRAILS & CLIMATE STUDIES Patrick Minnis NASA Langley Research Center Hampton VA, USA 30 October 2003
MOTIVATION • Air traffic increasing 2 - 5%/year over the globe • Ice supersaturation exists 10-20% of the time at flight altitude • Aircraft produce persistent contrails => cirrus aviaticus • Cirrus clouds affect radiation budget, possibly water budget • Aircraft exhaust might affect microphysics of extant cirrus • Contrail/cirrus impact least certain effect of aircraft on climate Can contrails have an effect large enough for concern? - Mitigation efforts by aircraft industry (new technology) - Mitigation efforts by air traffic control (new routing)
Aircraft exhaust short circuits natural cirrus formation - high humidities normally needed to make cirrus (C) - cirrus can exist at lower humidities (B) but need formation boost - no cirrus for RHI < 100% (A) T < -39°C
11-12 µm temperature difference from 1-km satellite data 24 October 2003; Okla, Ark, Kan, Missouri NOAA-15 1250 UTC NOAA-17 1738 UTC
11-12 µm temperature difference from 1-km satellite data 24 October 2003, Okla, Ark, Kan, Missouri <= Terra MODIS 2025 UTC NOAA-12 IR 2251 UTC Contrails have become cirrus clouds
11-12 µm temperature difference from 1-km satellite data 24 October 2003, Midwest <= NOAA-15, 1250 UTC NOAA-12, 2111 UTC => More contrail cirrus
11-12 µm temperature difference from 1-km satellite data 24 October 2003, Other areas TEXAS Idaho CA coast Pacific NW
CONTRAILS • Ubiquitous feature of our skies - increase cirrus coverage over areas with air traffic • Can affect climate by altering - Radiation budget (warming, cooling) - Changing moisture budget of upper troposphere?
CONTRAIL UNKNOWNS • contrail-cirrus coverage - geographical & temporal - now & future (requires modeling) • microphysics: optical depth, particle size - t mean between 0.1 and 0.4, varies between 0.01 & 2 - De changes over life cycle (5 -100 µm) • radiative forcing - depends on when and where it occurs • vertical spreading - dries the UT?
APPROACH Can it be significant? • Estimate lower & upper bounds of current contrail-cirrus impact - use empirical-theoretical estimates in RTM - relate cirrus change to air traffic Can we accurately predict it? • Develop climatology of contrail coverage, frequency, microphysics, radiative forcing - surface & satellite observations • Relate contrail observations to meteorological conditions - develop empirical-theoretical models to predict contrail coverage & properties
BACKGROUND • European studies - regional coverage from linear features in AVHRR imagery - tuned global coverage from ECHAMP/ECMWF output (Sausen et al.98) - recently estimated t = 0.11 from AVHRR, similar from GCM - GCM simulations of CRF (Contrail Radiative Forcing) • US studies - LaRC estimated t = 0.30 from AVHRR & GOES data over US - NASA GISS GCM simulation of CRF (Rind et al. 2000) - LaRC simulation of CRF from European tuned output/ISCCP/ERBE - lower bound (Minnis et al.99)
LaRC Contrail Minimum Radiative Forcing Estimates => Global contrail forcing: FSW = -0.003 to -0.012 Wm-2, FLW = 0.011 to 0.033 Wm-2 Fnet = 0.008 - 0.020 Wm-2 ; 0.017 Wm-2 for t = 0.3 European estimate 0.003 Wm-2 for t = 0.15 Greater over areas with heavy air traffic!
Current Estimates of contrail radiative forcing Minnis et al. 1999, GRL
LaRC Contrail Maximum Radiative Forcing Estimates • Estimate change in cirrus cloudiness due to air traffic - primary : sfc obs 1971-1995 • Repeat CRF calculations with cirrus change estimate - assume linear scaling with coverage, t = 0.15 - 0.25 • Use GCM conversion factors to estimate temperature changes Rind et al. (2000): = > 0.025Wm-2 for t = 0.25 New range of global radiative forcing = >0.006 - 0.025 Wm-2
To estimate upper bound contrail radiative forcing: • Measure trends in cirrus where contrails form & do not form (air traffic patterns) • Estimate impact of relative humidity • Estimate cirrus change for no humidity change - no trend over USA Study in "Contrails, Cirrus, and Climate," Minnis et al., 2003, accepted J. Climate
EVIDENCE FOR CHANGE IN CIRRUS CLOUDINESS DUE TO CONTRAILS IS PILING UP!
Trends in cirrus cover ( SFC OBS, 15+ yrs) & RH(300 hPA), 1971-1995 Cirrus trend, conf level 90% Cirrus trend RH 1992 contrail cover from Minnis et al. 2004
Cirrus & contrail seasonal trends Surface cirrus: 71-95 Satellite contrail coverage: 1990s (Mannstein et al. 1998, Palikonda et al. 2002) Satellite contrail frequencies: 1993-94 & 98-99 (Minnis et al. 2002) USA Europe • Contrails consistent with cirrus trend over USA, not Europe
Table 2. Contrails, mean cirrus cover, and cloudiness trends (%/decade) over air traffic regions from surface (CC) and ISCCP (CCI) data. The numbers in parentheses indicate the interannual variability in CC. The 1971-95 trends in CC are all significant at the 99% confidence level, except over WEUR where no trend is apparent. Minnis et al. 2004, J. Climate
Zerefos et al. 2003, JGR Cirrus coverage trends more positive over areas of heavy air traffic in a given region Based on ISCCP data
Mannstein et al., AAC, 2003 Over Europe, cirrus coverage, especially thin cirrus, coverage highly dependent on air traffic Based on Meteosat imagery linear contrail coverage over Europe only 0.3% cirrus delta = 3% Contrail spreading a factor of 10!
INTERIM SUMMARY • • Cirrus coverage is increasing over USA (consistent w/ seasonal contrail frequency • steady over Europe (inconsistent) • decreasing over western Asia, but not in areas of heavy air traffic • decreasing most over other land areas • • Cirrus is increasing over ocean (not many obs in pristine areas) • Is increase due to air traffic or weather changes? • - Zerefos and Mannstein results suggest the former • - Minnis et al. (2004) agree
ESTIMATION OF TEMPERATURE CHANGE OVER USA DUE TO CONTRAIL CIRRUS BASED ON GCM STUDY & CIRRUS OBS Minnis et al. 2004, J. Climate
IMPACT OF CIRRUS TREND • Contrail cirrus can account for all of observed warming over USA between 1975 & 1994 - Ozone impact not included!
con < 0.2% CHANGES IN ATMOSPHERIC TEMPERATURE, 1979-1997 200-850 mb FROM SATELLITE DATA AND ESTIMATED CONTRAIL RADIATIVE FORCING data from J. R. Christy Minnis et al. GRL (1999) present study
ESTIMATES OF ALL AVIATION FORCING WITHOUT CONTRAIL SPREADING - IPCC (1999)
Contrails are a problem, what can we do? BETTER UNDERSTANDING & PREDICTION • IMPROVED OBSERVATIONS OF LINEAR CONTRAILS & SPREADING - provides data for developing & validating models • RELATIONSHIP BETWEEN AIR TRAFFIC, CONDITIONS, & CONTRAILS - gives basis for parameterizing cirrus aviaticus • PREDICT WHEN & WHERE CONTRAILS WILL FORM
Linear Contrail Climatology Automated Contrail Detection NOAA-12 AVHRR, April 1997 VA NC 10.8-µm image detected contrails methodology from Mannstein et al. 1999
DECEMBER LINEAR CONTRAIL COVERAGE DURING 2001 FROM AVHRR Palikonda et al. 2003) 730 AM APRIL 230 PM DECEMBER
CONTRAIL DETECTION FROM SATELLITES • Very sensitive to particular imaging instrument response - need careful tuning of technique • Sometimes mistakes cirrus streaks as contrails - need error budget • Sometimes misses larger contrails - need more error budget This work is underway!
Comparison of contrail coverage (%) USA TimeSausen et al. 98Palikonda et al. 98 present (NOAA-16, 15) 1993-94 2001 Dec1.6 2.1 (Dec) 0.8 (0.9) Apr 2.0 2.0 0.7 (1.3) Jul0.5 1.3 0.3 (1.1) Oct1.9 1.9 0.8 (1.0) ------------------- Sausen et al. 98, Global Annual 0.087
Comparison of contrail properties SourceTimeODNCLRF (Wm-2) Minnis et al. 98, USA Apr 0.30 Minnis et al. 99, Global (theoretical) Annual 0.30 27 Palikonda et al. 98 Apr (0.27)12.4(14.2) N14, 93-94, USA Jul (0.30)16.0(22.3) ( N15&16, 01, USA) Oct (0.27)(10.4)) Dec (0.27)11(12.0) Meyer et al. 02, Europe Annual 0.11 14 (NOAA14, 95-97)
CONTRAIL PREDICTION • To relate contrails to the conditions, we have acquired a database of flight tracks for commercial air traffic over USA for 3 years - Garber et al. 2003 (NASA RP in review) • Use NCEP Rapid Update Cycle (RUC-2) experimental product to predict contrail occurrence - realtime USA contrail predictor online new RUC data not very good for contrails • Compare with satellite data
Contrail boundaries and relative humidity with respect to ice (RHI) 1600 UTC, November 18, 2001 RHI from RUC-2 analysis, 225 mb MODIS T4-T5 Image
CONTRAIL OUTBREAK OVER GREAT LAKES, 9 OCT 2000 "Fly" aircraft through RUC fields, simulate formation & spreading from Duda et al. 2003, JAS, accepted
Comparison of contrail amount from satellite data and frequency of potential contrail conditions from RUC-2 data SEPTEMBER OCTOBER
SUMMARY • Humidity fields critical for contrail formation, but correlations not always apparent because - extant cirrus may prevent detection of contrails from satellite contrail/cirrus conditions often equivalent - afternoon contrails may be less detectable because of overlap • 2001 coverage much less than 1993-94 - 1993-94 period one of moistest upper troposphere in 30 years (45.5%) - 2001 one of driest at high altitudes in 30 years (39.4%) - NOAA-16 may be less sensitive to contrails than NOAA-11 - NOAA-11 tendency for overestimation (~0.5%)
UPPER TROPOSPHERIC HUMIDITY OLD CONTRAILS ROADBLOCKS TO ACCURATE CONTRAIL PREDICTION THE AIR TRAFFIC SHUTDOWN CASE 2001 air traffic shutdown removed some impediments for contrail study - System cleared of commercial air traffic contrails by 0000 UTC, 12 September 2001
By studying the few contrails that occurred during the shutdown, we can tune a model that simulates contrails
12 SEPTEMBER CONTRAIL ANALYSES • Use GOES images to track & compute spreading • Estimate heights using stereographic analysis - GOES-8 & AVHRR, MODIS, or GOES-10 - Flight levels between 10.5 and 12.5 km • Compute optical depth using RUC temperature at 11.5 km (225 hPa) and adjacent clear-sky temperature
3-hour change in observed contrails NOAA-15 AVHRR 1-km Infrared Image 1245 UTC, 12 September 2001 Terra MODIS 1 -km Infrared Image 1545 UTC, 12 September 2001 H E
DURING THIS EVENT MEAN CONTRAIL LIFETIME IS 6.5 hr MEAN AREAL COVERAGE FOR EACH CONTRAIL IS2270 km2 MEAN OPTICAL DEPTH IS0.23 In the mean, over a 6.5 hour period, 8 contrails covered 18,000 km2 => We need to relate the contrails to the humidity fields at altitude!