Download
1 / 30
310 likes | 582 Vues
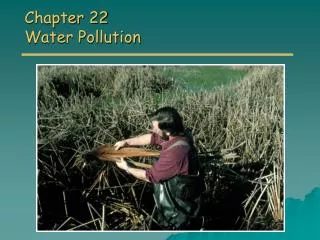
APES Chapter 11 Water and Water Pollution. By Sam, Zach, Schyler , Austin 1 st Period. Water Conflicts in The Middle East. 3 rivers are main source of water Nile, Jordan, Tigris-Euphrates Ethiopia, Sudan, Egypt rely on Nile Egypt is last in line Possible cause for war

E N D
APES Chapter 11Water and Water Pollution By Sam, Zach, Schyler, Austin 1st Period
Water Conflicts in The Middle East • 3 rivers are main source of water • Nile, Jordan, Tigris-Euphrates • Ethiopia, Sudan, Egypt rely on Nile • Egypt is last in line • Possible cause for war • Turkey is building series of dams to regulate flow to Syria and Iraq • Limit water flow by over 35% • Resolution is necessary to prevent global conflict
11.1 Waters, Importance, Use, and Renewal • Science: Importance and Availability of Water • Covers 71% Of Earths Surface • Humans are made of 60% water • Weeks w/o food, only days w/o water • Poorly Managed Resource • Benjamin Franklin “It is not until the well runs dry that we know the worth of water.” • Freshwater is very rare and a small portion of all the water available. • 100 Liters(26 Gallons) Total=2.5 Teaspoons Fresh • Freshwater supply is continuously collected, purified, recycled, and distributed in hydrologic cycle by the sun.
11.1 Continued • Science: Surface Water • Water that runs across earths land into rivers, lakes, wetlands etc. • Precipitation that doesn’t return to atmosphere, or infiltrate ground is called surface runoff. • The place where this water goes is called its watershed or drainage basin • 2/3 of the worlds runoff is lost due to floods. • Remaining 1/3 is reliable runoff • Amount that is stable (or we can count on) • Science: Groundwater • When precipitation infiltrates ground and percolates down into voids between rocks. • Depth of penetration is determined by Zone of Saturation • The Water table is located at the top of the zone of saturation • Even deeper are aquifers (porous layers of rock and sand that hold water • Aquifers are replenished through percolation called Natural Recharge
11.1 Continued • Reliable Surface Water • We withdraw 34% currently • 20% is left in streams for transportation, and dilution of pollutants • Use of Worlds Fresh Water • Use 70% of water we withdraw wolrdwideto irrigate one-fifth of worlds cropland • The land produced about 40% of worlds food (as well as 2/3 of worlds rice and wheat), • Industry uses 20% with cities/residences at 10% • U.S. Water Use • East’s major uses are energy, cooling, manufacturing • West’s is agriculture.
11.2 Supplying More Water • Global Outlook: Freshwater Shortages • 1 of every 6 people do not have access to enough, affordable clean water. • That number is said to increase to 1 of 4 by 2050 • Hydrological Poverty (cannot afford drinking water) • Increasing Freshwater Supplies • Create Dams and Reservoirs • Withdrawal of groundwater, and desalinize salt water
11.2 Large Dams/Reservoirs • Pros • Useful for recreation and fishing • Hydropower • Downstream flooding reduced • Year round irrigation water supply • Cons • Large water losses through evaporation • Flooded land displaces people and croplands • Spawning and Migration are sometimes disrupted • Croplands and estuary's downstream are deprived of nutrient silt
11.2 Aral Sea • Case Study: Aral Sea Disaster • Once worlds 4th largest freshwater lake • Started shrinking in 1960. • Therefore became more salty • Water is diverted for growing • Cotton • Food Crops • BAD! • Salty desert • Ruins economy • Increasing health problems • Ecological disruption 1989 2003 2009
11.3 Reducing water waste Humans waste 2/3 of water that we use, but could cut that to just 15%. US loses about ½ of the water we withdraw but is economically and technically feasible to reduce water loss by 15%.
Water waste causes • Number one cause is the low price of water • Little to no financial incentive to invest in water saving technologies • Number two cause is the lack of government subsidies for improving efficiency of water use. • Improved irrigation techniques could reduce 60% water waste by 5-20%.
Types of irrigation • Flood irrigation: Water flows from source in ditches to crop fields and delivers more water than neccessary. 40% loss of water • Center pivot low-pressure sprinkler: Uses pumps to spray water on crops, around 80% reaches crops. • Low energy precision application sprinklers: A form of center pivot that puts 90-95% of water where crops need it • Drip irrigation- Consists of a network of perforated plastic tubing installed below ground level. Holes in tubing deliver drips of water at a slow steady rate. 90-95% effective
How we can save water • Changing to yard plants that need little water, fixing leaks, raising water prices, and using water saving toilets will save water. Switching to waste treatment sites that accept only non toxic waste will also save water. • 1/5 of US public water systems do not have water meters and charge a single low rate for unlimited water use. • Boulder, Co installed meters, usage went down by 33%.
Flooding • Heavy rainfall, rapid snowmelt, removal of vegetation, and destruction of wetlands cause flooding. • Floodplains occur when water overflows its normal channel and spills into the adjacent area. They help to provide erosion control, to maintain high water quality, and to recharge groundwater.
Houses and Floods • To allow people to live in floodplains, rivers are narrowed and straightened, equipped with levees and walls, and damned to create resourvouirs. • Since the 1960’s, humans have increased flooding by removing water absorbing vegetation and draining wetlands that absorb flood impact. • Although floods have several benefits, they kill thousands of people a year.
Reducing flood risks • We can reduce the risk of floods by controlling river water flows, preserving and restoring wetlands, managing flood prone areas, and choosing to not live in flood plains. • To reduce flood risk we can: • Straighten and deepen streams (channelization) • Put in levees and floodwalls. These do not protect against powerful floods and cause damage downstream. • Build dams to release water gradually • Identify and manage floodplains.
Water pollution- any chemical, biological, or physical changes in water quality that harms living organisms or makes water unsuitable for desired use • Examples of pollutants can be: • Disease: Bacteria, viruses, parasitic organisms • Organic waste: animal manure or plant debris • Inorganic Chemicals: acids, lead, arsenic, selenium, salts, fluorides all found in waters • Organic Chemicals: Oil, gasoline, plastic, pesticides, detergents • Plant Nutrients: Nitrates, Phosphates, or ammonium ions • Sediments: Overwhelming soils and silt • Radioactive Materials: Radon, Uranium, Cesium, and Thorium • Thermal: Excessive heating 11.5 Water Pollution: Types, Effects, and Source
About 95% of people in developed countries have access to safe clean drinking water • Only 1 in 5 people in developing countries do not have access to clean water • Each day 9,300 people die due to infectious diseases spread by contaminated water • Most of these are children • Water can become contaminated from either a • Point source: Discharge pollutants at a specific location through drain piped, ditches, sewer lines directly into bodies of water • Nonpoint source: Where pollutants are released in scattered locations and can not be traced back to any single site of discharge, an example is chemical runoff • The UN estimates that it would take around $23 billion every year to supply safe water to 1.4 billion people
Pollution of Freshwater Streams, Lakes, and Aquifers • Naturally rivers or streams can clean themselves as pollutants build up and or the water begins heating up, as the waterway flows the pollutants of heat will disperse and at best disappear • When these waterways have trouble diluting pollutants it is usually due to either drought, damming, or water diversion for agriculture • Bacteria help to break down wastes in streams and rivers, but when doing so they eat up oxygen creating a oxygen sag curve in the water • When oxygen levels lower less organisms can live in the waters • A common example of a Oxygen sag curve is when industries release heated water into streams • In the 1970’s the Water Pollution Laws were passed • This act increased the number and quality of wastewater treatment plants in the U.S. and most other developed countries
Lakes • When lakes are polluted it is much harder for them to become less diluted then it is a river or stream • This is because a lake has little to no flow, they also have vertical levels within them that aren’t often mixed together • As a result lakes and reservoirs are significantly more prone to contamination • Eutrophication- is the name given to the natural enrichment of lakes, mostly from runoff of plant nutrients such as nitrates and phosphates from surrounding land • Oligotrophic lakes are low in nutrients, but look more clear • When humans accelerate the input of this plant nutrients into lakes it is called Cultural Eutrophication • As water temperatures heat up bacterial growth can also increase and cause the lakes productivity to decrease • As the bacteria die they also cause the dissolved oxygen levels to decrease • 85% of medium to large lakes have been effected by Cultural Eutrophication
Aquifers • When ground water becomes contaminated it poses a serious threat to human health • Groundwater pollution comes from numerous sources • As groundwater becomes contaminated it cannot be cleansed by itself because it does not flow like streams of river • Groundwater usually flows less than .3 meters or 1 foot per day, as this rate water cannot be diluted • It can take hundreds of thousands of years for contaminated groundwater to cleanse itself
Additional Information • In 2003 the World Commission on water declared that half of the worlds 500 rivers are heavily polluted • Only 10% of sewage produced in Chinese cities is treated • An EPA survey of 26,000 industrial waste ponds and lagoons in the U.S. found that 1/3 had no prevention for toxic liquids from leaking into aquifers • 1/3 of these sites are within 1 mile from a drinking water well • Scientist expect that 76,000 underground tanks that store gasoline, diesel fuel, or oil will leak into the soils and eventually into water • A single tank can cost $25,000- $250,000 just to determine the leak and then up to $10,000-$250,000 to clean it • Prevention contamination is the most effective and cheapest way to protect groundwater resources
Coastal Pollution • Coastal waters bear brunt of pollution • 85% of sewage from coastal cities in Mediterranean dumped untreated • Viruses thrive in sewage • Runoff from agriculture/sewage can cause harmful algal blooms (HABs) • 150 oxygen depleted zones globally • Solutions: Reduce nitrogen inputs, plant forests, improve sewage treatment, reduce auto emissions, use renewable energy
Case Study: Chesapeake Bay • Chesapeake Bay, United States’s largest estuary, has had an extreme pollution problem • Population growth of 13 million in 60 years • Drainage basin encompasses 6 states • Shallow; only 1% of waste entering is flushed to ocean • Chesapeake Bay Program – 1983 • Country’s most ambitious attempt at integrated coastal management • Established land use regulations in watershed states, banned phosphate detergents, upgraded sewage treatment plants, restored wetlands, replanted sea grasses • Success! Phosphorus declined 27%, nitrogen down 16%, and grasses growing back.
Effects of Oil on Ocean Life • Most oceanic oil pollution stems from human activities on land • Every 8 months an amount of oil equal to the 1989 Exxon Valdez tanker spill in Alaska drains into oceans • Hydrocarbons in oil immediately kill some organisms, especially larvae. Oil can coat other organisms • Heavy components sink to the floor and can smother bottom dwellers or kill coral reefs • MOST aquatic life recovers from exposure to CRUDE oil within 3 years. • Recovery from exposure to REFINED oil can take 10-15 years.
Protecting Coastal Waters • PREVENTION • Reduce input of toxic pollutants • Separate sewage and storm lines • Ban dumping of sewage/waste in coastal waters • CLEANUP • Sprinkle nanoparticles over an oil spill to dissolve the oil • Use wetlands, solar-aquatic, or other methods to more carefully treat sewage
Water Pollution Policy • Federal Water Pollution Control or Clean Water Act 1972 + Water Quality Act 1987 • Sets standards to control key pollutants • Requires permits for polluters • EPA experimented with a discharge trading (market) policy • Efficacy is debated • Pollution control is often absent or unenforced in LDCs, resulting in polluted water used for drinking, bathing, and washing clothes.
Reducing Water Pollution from Point Sources • Septic Tanks • Sewage Treatment Plants – 2 stage • Primary Sewage Treatment: Physical. Screens and grit tank remove floating and suspended solids • Secondary Sewage Treatment: Biological. Aerobic bacteria remove up to 90% of organic wastes • Water then undergoes bleaching and disinfection
Improving Sewage Treatment • Prevent Toxic/hazardous chemicals from reaching sewage treatment plants • Require industry to remove hazardous waste before exporting water • Encourage elimination of toxic chemicals • More buildings switch to composting toilet systems • Cheaper to install and maintain • Save water
Working With Nature to Treat Sewage • Living Machines • Water flows through tanks with algae and microorganisms which decompose organic wastes • Water hyacinths and other organic plants take up resulting nutrients • Water then passes through an artificial marsh, filtering remaining organic waste • Snails and zooplankton consume microorganisms, which are then consumed by bait fish. After 10 days, final filtration and cleansing occur. • UV light or ozone can make the water clean enough to drink • Costs about as much as a conventional sewage treatment plant • Acrata, California uses 65 acres of natural wetlands to treat sewage
Politics: Reducing Water Pollution from Point Sources in the United States • Good News: between 1972 and 2002, • US fishable and swimmable stream lengths increased from 36% to 60% • Proportion of US population served by sewage treatment plants went from 32% to 74% • Bad News • In 2000, EPA found that 45% of lakes and 40% of streams were too polluted for swimming of fishing • Most livestock wastes are untreated and stored in lagoons that can leak, overflow, or rupture • Fish caught in 25% of US lakes have too much toxic buildup to eat • Should Clean Water Act be strengthened or weakened?