Download
1 / 13
160 likes | 515 Vues
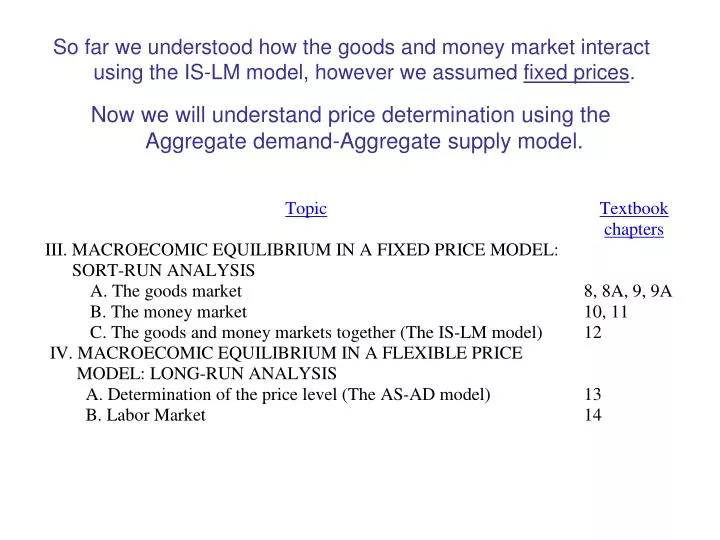
So far we understood how the goods and money market interact using the IS-LM model, however we assumed fixed prices . Now we will understand price determination using the Aggregate demand-Aggregate supply model. Aggregate demand (AD) curve - The AD curve - Deriving the AD curve

E N D
So far we understood how the goods and money market interact using the IS-LM model, however we assumed fixed prices. Now we will understand price determination using the Aggregate demand-Aggregate supply model.
Aggregate demand (AD) curve - The AD curve - Deriving the AD curve - Shifts of AD curve • Aggregate supply (AS) curve and Equilibrium price level - The AS curve - The AS curve (short run) - Shifts of AS curve (short run) - Short run equilibrium price level. The AD and AS curve (short run) - The AS curve (long run) • Short and Long run impact of monetary and fiscal policies. • Causes of inflation Short run Long run
Aggregate demand (AD) curve - The AD curve A curve that shows the relationship between aggregate output (Y)and the price level (P). Each point on the AD curve is a point at which both the goods market and the money market are in equilibrium.
r Ms r r1 r1 • Deriving the AD curve (Effect of an increase in price: P0→ P1) r0 r0 Md1 Md0 I M I1 I0 I P P1 P0 AD Y1 Y0 Y
Aggregate Supply (AS) curve and Equilibrium price level - The AS curve A curve that shows the relationship between the aggregate quantity of output supplied by all firms (Y) and the overall price level (P). - The AS curve (short run) - Capacity constraints:A-B vs. C-D - Responses of input prices tochanges in the overall price level:In the short run wages adjust slower than prices. (short run) Maximum level of output with no changes in input prices. Ymax
(short run) (short run) (short run) (short run) - Shifts of AS curve (short run) Higher costs: - higher input prices - higher wage rates Stagnation: - capital deterioration Public Policy: - waste and inefficiency - over-regulation Natural disasters and wars Lower costs: - lower input prices - lower wage rates Economic growth: - more capital - more labor - technological change Public Policy: - tax cuts - deregulation Good weather
- Short run equilibrium price level. AD and AS curve (short run) (short run)
AS curve (long run) is vertical - The AS curve (long run) In the long run wages and other input prices fully adjust to changes in prices - Long run adjustment when initial (short run) output equilibrium I is above potential GDP: Potential GDP: Level of aggregate output that can be sustained in the long run without inflation. .
- Long run adjustment when initial (short run) output equilibrium is below potential GDP.
(short run) (short run) Short run impact of monetary and fiscal policies Long run impact of monetary and fiscal policies Since the AS (long run) curve is vertical, neither monetary policy nor fiscal policy has any effect on aggregate output in the long run. when economy is initially on the flat part of AS (short run) when economy is initially near maximum capacity (i.e. vertical part of AS (short run) )
Causes of inflation Inflation: An increase in the overall price level. Sustained inflation: Occurs when the overall price level continues to rise over some fairly long period of time. - Demand-pull inflation Previous slide - Cost-push/supply-side inflation Cause: increase in aggregate demand. Cause: increase in costs (e.g. increases in oil price). Stagflation: output is falling at the same time prices are rising ( ).
- Expectations and inflation Expectations can lead to an inertia that makes inflation difficult to stop → inflationary spiral. An increase in inflationary expectations that causes firms to increase their prices shifts the AS curve to the left - Money and inflation Cause: Sustained Inflation from an Initial Increase in G and Fed Accommodation. Hyperinflation: A period of very rapid increases in the price level