Download
1 / 62
620 likes | 751 Vues
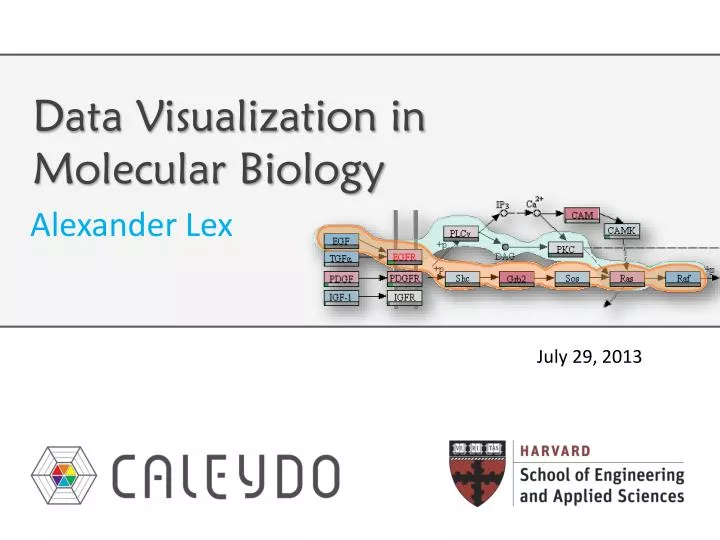
Data Visualization in Molecular Biology. Alexander Lex. July 29, 2013. r esearch requires understanding data b ut there is so much of it…. What is important? Where are the connections? . p rotein expression. publications. microRNA expression. clinical parameters. mRNA expression.

E N D
Data Visualization in Molecular Biology Alexander Lex July 29, 2013
research requires understanding data • but there is so much of it…
What is important? • Where are the connections?
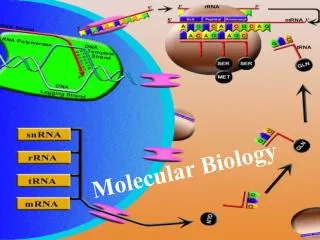
protein expression publications microRNA expression clinical parameters mRNA expression methylation levels mutation status pathways copy number status sequencingdata
Data Visualization • … makes the data accessible • … combines strengths of humans and computers • … enables insight • … communicates
Who am I? • PostDoc @ Harvard, Hanspeter Pfister’s Group • PhD from TU Graz, Austria • Co-leader ofCaleydo Project
What is Caleydo? • Software analyzing molecular biology data • Software for doing research in visualization • developed in academic setting • platform for trying out radically new visualization ideas • Quest for compromise between academic prototyping and ready-to-use software
What is Caleydo? • Open source platform for developing visualization and data analysis techniques • easily extendible due to plug-in architecture • you can create your own views • you can plug-in your own algorithms
The Team • Marc Streit Johannes Kepler University Linz, AT • Christian Partl Graz University of Technology, AT • Samuel Gratzl Johannes Kepler University Linz, AT • Nils Gehlenborg Harvard Medical School, Boston, USA • Dieter Schmalstieg Graz University of Technology, AT • Hanspeter PfisterHarvard University, Cambridge, USA
Caleydo StratomeX Cancer Subtype Visualization
Cancer Subtypes • Cancer types are not homogeneous • They are divided into Subtypes • different histology • different molecular alterations • Subtypes have serious implications • different treatment for subtypes • prognosis varies between subtypes
Cancer Subtype Analysis • Done using many different types of data, • for large numbers of patients.
Goal: • Support tumor subtype characterizationthrough • Integrative visual analysis of cancer genomics data sets.
Tabular Data Stratification Patients Candidate Subtypes Genes, Proteins, etc.
Stratification of a Single Dataset Cluster A1 • Subtypes are identified by stratifying datasets, e.g., • based on an expression pattern • a mutation status • a copy number alteration • a combination of these Cluster A2 Cluster A3
Header /Summary of whole Stratification Patients Candidate Subtype / Heat Map Genes
Stratification of Multiple Datasets Cluster A1 B1 B2 Cluster A2 Cluster A3 Tabulare.g., mRNA Categorical, e.g., mutation status
Stratification of Multiple Datasets Cluster A1 B1 B2 Cluster A2 Cluster A3 Tabulare.g., mRNA Categorical, e.g., mutation status
Many shared Patients Clustering of mRNA Data Stratification on Copy Number Status
Stratification of Multiple Datasets Cluster A1 B1 B2 Cluster A2 Cluster A3 Tabulare.g., mRNA Categorical, e.g., mutation status
Stratification of Multiple Datasets Dep. C1 Cluster A1 B1 B2 Cluster A2 Dep. C2 Cluster A3 Tabulare.g., mRNA Categorical, e.g., mutation status Dependent Data,e.g. clinical data
How to Choose Stratifications? • ~ 15 clusterings per matrix • ~ 15,000 stratifications for copy number & mutations • ~ 500 pathways • ~ 20 clinical variables • Calculating scores for matches • Ranking the results
Query column Result column Considered Datasets Ranked Stratifications
Algorithms for finding.. • … matching stratification • … matching subtype • … mutual exclusivity • … relevant pathway • … stratification with significant effect in survival • … high/low structural variation
Live-Demo! http://stratomex.caleydo.org
Caleydo enRoute Pathways & Experimental Data
Experimental Data and Pathways • Cannot account for variation found in real-world data • Branches can be (in)activated due to • mutation, • changed gene expression, • modulation due to drug treatment, • etc.
Why use Visualization? • Efficient communication of information • A -3.4 • B 2.8 • C 3.1 • D -3 • E 0.5 • F 0.3 B A C D E F
Experimental Data and Pathways [KEGG] [Lindroos2002]
Five Requirements • Ideal visualization technique addresses all • Talking about 3 today
R I: Data Scale • Large number of experiments • Large datasets have more than 500 experiments • Multiple groups/conditions
R II: Data Heterogeneity • Different types of data, e.g., • mRNA expression numerical • mutation status categorical • copy number variation ordered categorical • metabolite concentration numerical • Require different visualization techniques
R V: Supporting Multiple Tasks • Two central tasks: • Explore topology of pathway • Explore the attributes of the nodes (experimental data) • Need to support both! B A C D E F
Concept Pathway View Pathway View enRoute View B B B A A A C C C D D D E E E F F F Group 1 Dataset 2 Group 1 Dataset 1 Group 2 Dataset 1
Pathway View • On-Node Mapping • Path highlighting with Bubble Sets [Collins2009] low high IGF-1
enRoute View B A C D E F Group 1 Dataset 2 Group 1 Dataset 1 Group 2 Dataset 1 Path Representation
enRoute View B A C D E F Group 1 Dataset 2 Group 1 Dataset 1 Group 2 Dataset 1 Experimental Data Representation
Experimental Data Representation • Gene Expression Data (Numerical) • Copy Number Data (Ordered Categorical) • Mutation Data
CCLE Cell lines & Cancer Drugs Analysis by Anne Mai Wasserman
Collaboration with AM Wassermann, M Borowsky, M Glick @NIBR Managing Pathways & Cross-Pathway Analysis