Download
1 / 38
380 likes | 754 Vues
Irrigation in the Jordan Valley and the Workplan Of the Jordan Component Deficit Irrigation for the Mediterranean Agricultural System-DIMAS Project No. ICA3-2003-509087 By Muhammad R. Shatanawi and Sawsan al-Naber Presented for the Kick-off Meeting of the Project Held at

E N D
Irrigation in the Jordan Valley and the Workplan Of the Jordan Component Deficit Irrigation for the Mediterranean Agricultural System-DIMAS Project No. ICA3-2003-509087 By Muhammad R. Shatanawi and Sawsan al-Naber Presented for the Kick-off Meeting of the Project Held at Department of Agronomy, University of Cordoba Cordoba, Spain 29 September – 2 ocotber, 2004
Background Jordan is a semi arid country located in the east of the Mediterranean. Bordered by Syria to the north, Saudi Arabia to the south. Iraq and Saudi Arabia to the east’ and Palestine and Israel to the west. Area: 89.400 Km2 Population: 5.48 million as of 2003 GDP: 1670 USD Population growth: 2.84%
Physiography Jordan can be divided into three distinct regions: 1. The Jordan Rift Valley (JRV): it is part of the Great Rift Valley; JRV run from lake Taberia to the Gulf of Aqaba. The Jordan Valley is part of the JRV (Lake Taberia-Dead Sea). 2. The Pateau: Consists of the mountains and the upland plains with elevation ranging from 300m to 1200m. Average annual precipitation is 300mm. 3. The Steppe area and the desert: It represent about 90% of the country. Rainfall ranges from 35 mm to 200 mm
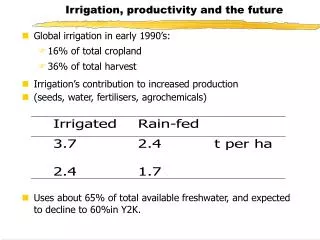
Agricultural Areas • The total area that can be put into cultivation through rainfed is approximated at 0.38 million hectars representing about 4% of the area of the country • The actual cultivated rainfed has reached 0.26 million hectars in 2003 • The irrigated area is about 76,000 ha
Climate • Jordan climate can be calssified as a Semi-desert area. Summer maximum temperatures average 32o C for the highlands and 38 oC for the Jordan Valley and the eastern deserts. • Winter temperature range from 1-17o C in the highlands and the desert areas, and 8-21 oC in the Jordan Valley. • The raining season in Jordan extends from October to April, with peak taking place during January and February.
Water Resources Jordan is considered among few countries of the world with limited water sources. The per capita share of water is less than 170 m3/c/day. The share will drop to less than 100 m3/c/day in 25 years from now when the population is doubled. The agricultural sector will be the most affected sector in the country.
Uses in MCM Total Year Municipal Industrial Irrigation Other Uses Uses Ground Surface 1985 116.00 22.00 204.00 292.85 4.00 638.85 1986 134.70 23.00 204.00 252.24 5.00 618 .94 1987 150.40 23.50 243.00 322.46 5.00 744.36 1988 164.70 39.22 289.20 318.71 4.77 816.60 1989 169.77 36.30 315.40 302.95 5.92 830.34 1990 175.57 36.64 329.44 322.59 5.26 869.50 1991 173.23 41.83 325.93 287.26 4.82 833.07 1992 206.64 34.78 332.70 3 67.77 8.84 950.73 1993 213.54 33.25 341.10 385.34 10.35 983.58 1994 215.82 24.45 305.91 349.35 13.32 908.84 1995 239.85 32.57 285.92 311.05 9.46 878.22 1996 236.36 35.76 289.69 308.18 11.79 881.78 1997 235.63 37.24 266.19 325.49 11.11 875.66 1998 236 .00 38.11 258.35 353.34 11.74 897.54 1999 240.00 40.00 255.00 295.00 Water Use per Sector in Jordan (1985-2002) 10.00 840.00 2000 260.00 45.00 265.00 275.00 11.50 856.50 2001 275.50 45.00 256.00 315.00 11.60 903.50 2002 285.00 47.00 263.00 325.00 15.00 935.00
Water Supply and Requirements (MCM/year) World Bank (2001)
Meeting Water Deficit • Demand management option including: improving irrigation efficiencies and reducing municipal water losses; Deficit irrigation; adopting rational cropping pattern. • Securing additional water supply: Desalination of water for M & I, water importation, enhancing water supply in form of water harvesting and artifical recharge. • Reuse of reclaimed wastewater: This requires good water treatment to a level acceptable for unrestricted irrigation. The growing deficit of water in Jordan is serious problem. Decision makers and policy planners should consider several options to alleviate the problem such as:
Irrigation in Jordan Areas developed for irrigated agricultural amounts to approximately 76.000 ha. Of this total 33,000 ha are in the Jordan Valley and the southern Ghors which are primary developed by the Government. The rest of the irrigated area of about 43,000 ha have been developed by the private sector in the plateau and the Badia regions depending mainly on groundwater.
Irrigation Development • Historically, irrigation in Jordan was concentrated around springs and along river and wadi beds where the traditional surface irrigation was applied. • Early 1960, the government of Jordan put high priority in development large irrigation projects starting with building the East Ghor canal. • In the late 1980s and early 1990s, the private sector got involved in the development of ground water for irrigation either by individuals or through agricultural companies.
Irrigation projects in Jordan can be classifies into two categories: • Public irrigation projects in the Jordan Rift Valley • The irrigation in the upland and the desert.
Irrigation in the Jordan Rift Valley The JRV consist of: • The Jordan valley irrigation Project (the study area). The arable land in the JV is about 36,000 ha. Due to limited water availability only 28,000 ha are irrigated. • The southern Ghors: The irrigated area in SG is about 5000 ha with potential increase to 6500 ha.
Water resources in the Jordan valley for the period 1997-2000
Area, number, and production of Fruit trees in Jordan 2001 (Production in thousand tons)
Irrigation management in the Jordan Valley • The JV irrigation project is a public scheme controlled and managed by Jordan valley Authority (JVA). • The land under irrigation is divided into farm units of 3-4 ha each. Each farm is provided with water through farm intake (FTA). • Water is conveyed from different sources through the main canal (King Abdullah Canal, KAC). • More than 90% of the area receive irrigation water through pressurized pipes. • The pressure head is provided from pumping stations along KAC or utilizing the natural head of higher elevation dams.
Irrigation Systems The most common on-farm irrigation system is micro irrigation, which covers about 64% of the Jordan Valley area. Very limited number of farms use sprinkler irrigation while the rest (about 35%) are still using the conventional surface irrigation that is practiced in citrus and banana farms
Irrigation Water Management The Division of Operation and Maintenance of JVA is in charge of irrigation water management. Farmers in the Jordan Valley submit their irrigation request for their units early in the morning to ten stage offices distributed along the Valley. The requests are processed according to supplies fed from KAC or others irrigation projects. Demands are compared with supplies and irrigation schedules are issued to ditch riders who open the lateral turnouts of open channel system or farm turnouts or intakes of piped irrigation systems.
Release Control Releases from dams are then determined taken into consideration the target level until the end of the season. In the daily water balance, uncontrolled resources (flows from Yarmouk & others side Wadis) are first used starting from south to north, then controlled resources according to per-defined schedules also from south to north. Excess water in KAC is stored in Wadi Arab Dam by back pumping. 50 MCM are pumped to Amman for municipal and industrial uses
Draught Measures The frequent occurrence of drought especially during recent years has put many constraints on irrigated agriculture in the Jordan Valley. The JVA has taken certain management practices and measures to ease the problem
Long Term Measures • Increase the volume and number of storage facilities by constructing new dams and enlarging the capacities of existing ones; • Plan for a dynamic cropping pattern by limiting the area of perennial crops and fruit trees to less than 30% to allow flexible cropping pattern during drought years; • Encourage the introduction of water saving technology like the use of micro irrigation, mulches, and protected agriculture; • Augment water resources through the use of treated wastewater and ground water during drought years
Short Term Measures • Limit the area planted with annual crops and vegetables during the period of high consumption, especially during summer months. In the years of severe drought, panning is imposed on summer plantation; • Reduce the acreage of irrigation area through reducing water allocation but allowing the irrigation of fruit trees; • Enforce conservation measures thought the control of water wastes, spills and illegal uses; • Practice deficit irrigation to the extend that to keep fruit trees growing or surviving while risking the yield; • Some farmers exploit groundwater wells to combat shortages of water supply in a drought year.
Problems in Exciting Irrigation Management • Problems related to Hydraulic Network Design • Problems related to rotation schedules • Problems related to maintenance of JVA network • Problems linked to water allocation
CWR Vs Actual Deliveries JVA allocation system is based on dividing the year into two periods (wet period and dry period) • During the wet period (December-March), water resources are available in abundant quality. Irrigation needs are less. So water is distributed to farmers when they require it. • During dry period (April-November), each crop receive a fixed allocation of water as: 8 mm/day for Banana 4 mm/day for Citrus 2 mm/day for Vegetable • In case of draught years, the allocation is reduced to 50% (i.e 4,2 and 1 mm/day).
Farmers Adaptation Farmers have different method or ways to adapt to the situation of scarcity. Some of these ways are: • Some farmers consume more than their allocated water: with FTA flow higher than the nominal and with illegal openings • Farmers request Extra-hours to JVA stage office: this is the only flexibility that exists in the allocation system, but there is an urgent need for clarified rules and more transparency. • Farmers adapt their cropping pattern: For example, a share of the area stays bare to transfer its water rights to the rest of the fields. Some farmers have access to other resources • Water storage: Pool capacities are around 430 m3. Even if it is not the first function of pools, according to farmers, it can be strategic in peak periods for a complement during a short time.
Project Team • Inventory of DI practice (WP4) • Collection of economic data (WP5) • Field research for model testing (WP3) • Scaling of DI practices (WP6) • Recommendation of DI to users (WP7)
Project Team • Prof. Muhammad R. Shatanawi: (Water resources and irrigation), Team leader and technical person in charge. • Ms. Sawsan al-Naber: (Irrigated Agriculture), Administrative assistance, will be trained also on the different modules of the computer models. • Prof. Mostafa Qrunfleh: (Horticulture; fruit tree specialist), will be in charge of supervising field research experiments on citrus. • Research Assistants: will be in charge of carrying day-to-day field work with the regards to field experiments at the three locations. From the University of Jordan
From NCARTT • Dr. Abdulnabi Fardous; Director (Soil physics and irrigation),will facilitate research in NCARTT research stations and will carry out soil physical analysis and will disseminate results to water agencies. • Mr. Mohammed Jitan; (Ph.D. candidate in irrigation), will supervise research in NCARTT and JVA fields, will be in charge of collecting daily climatic data.
From JVFA • Mr. Sulieman Ghazawi, will provide site for the 3rd experiment, will help in documentation of DI, will surprise survey on DI invnetory, will disseminate results to farmers, • Field Researchers, will work with farmers in survey and inventory.
Field Experiment • Three experiment will be conducted in three different locations (sites) in the Jordan Valley • Site number one: North Shouna (private orchard) and Washington Novel Orange will be used. Site number two: Wadi El-Yabis, a government station that belongs to National Center for Agricultural Research and Transfer of technology (NCARTT) and Shamouti orange will be used. Site number three: The University of Jordan Agricultural Research Station, and Eureka lemon will be used.
Site one Site two Site three
Two citrus species and three citrus cultivars will be used: Citrussinensis CV. Washington Navel Citrussinensis CV Shamouti Citruslimon CV. Eureka • Three water regimes (treatments) of irrigation will be used: Full irrigation (FI): 4 mm/day Deficit irrigation (DI1): 3 mm/day Deficit irrigation (DI2): 2 mm/day
For each experiment, the irrigation water treatment will be represented by nine trees and four replications (total of 108 tree) in a randomized complete block design (RCBD). • The trees in the three sites are reproductive six to eight years old, and are five to six meters apart.