Download
1 / 22
220 likes | 975 Vues
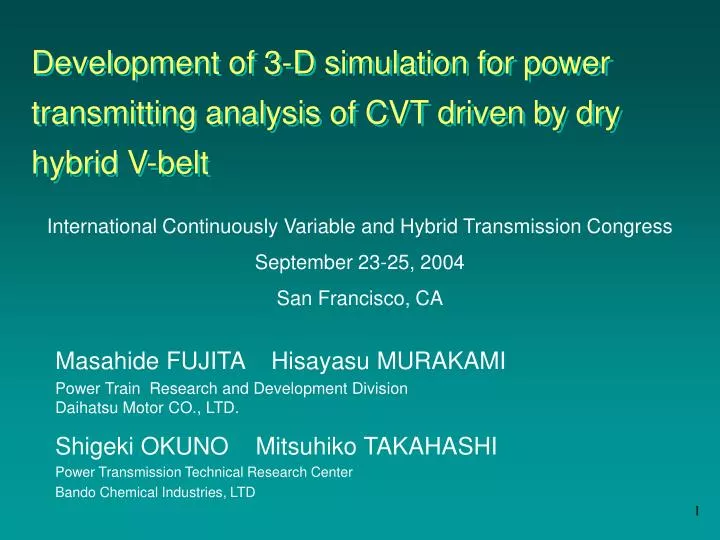
Development of 3-D simulation for power transmitting analysis of CVT driven by dry hybrid V-belt. International Continuously Variable and Hybrid Transmission Congress September 23-25, 2004 San Francisco, CA. Masahide FUJITA Hisayasu MURAKAMI

E N D
Development of 3-D simulation for power transmitting analysis of CVT driven by dry hybrid V-belt International Continuously Variableand Hybrid Transmission Congress September 23-25, 2004 San Francisco, CA Masahide FUJITA Hisayasu MURAKAMI Power Train Research and Development DivisionDaihatsu Motor CO., LTD. Shigeki OKUNO Mitsuhiko TAKAHASHI Power Transmission Technical Research Center Bando Chemical Industries, LTD
Contents • Background • New CVT • 3D-simulation • Outcomes • Transmitting efficiency • Dynamic strain on the belt • Conclusions
Main products of Daihatsu: Small-sized Cars Background Application New CVT Commercialized CVT Metal pushing V-belt Excessive quality Dry hybrid V-belt 1L2L Higher efficiency Engine displacement
New CVT with Dry Hybrid V-belt Advantage: Air cooling No lubricant =Higher efficiency High torque capacity with improved wider belt =Increased belt mass / inertia Tension bands Blocks (Resin coated aluminum alloy) Aramid cord Rubber
Merit Increase contact angle Torque capacity rise Belt tension control Better efficiency New CVT system • Demerit • Reverse bending force • Less durability Tension Pulley Driven Pulley Driving Pulley
3-D dynamic simulation Belt movement in high speed: Dynamic measurementsisimpossible 3-D dynamic FEA is needed Driven Pulley Driving Pulley 3800rpm 30m/s
Required features: Precise inertia force calculation Advanced contact search Dynamic belt behavior visualization (stress & others) Explicit FEM code ESI Software's PAM-MEDYSA(MEchanical DYnamic Stress Analysis) Selection of FEM code
Building the model as it is Cord anisotropy Contacts defined between block & tension band Modeling of dry hybrid V-belt Block Resin Rubber Upperbeam Tension band Lowerbeam Cord Aluminum
All parts: Defined aselastic Components of pulley shaft Sliding interface taking account of shaft clearance Modeling of CVT pulleys Fixed pulley Movable pulley Slide keys Fixed pulley shaft w/ clearance Resin bush
Initial state (Belt: Tension free) Move driving pulley (apply tension to the belt) Rotate driving pulleyApply absorbing torque Calculation procedures Driving pulley Driven pulley
Outcome on initial model Transmitting efficiency At high speed running: lower efficiency Difference (simulation/experiment): 2% 100 99 98 Efficiency(%) 97 96 95 94 0 10 20 30 40 Belt velocity (m/s) Ratio: High (0.407) Input torque: 80Nm Calculated Measured All Parts:elastic 2%
Matching of simulation with measurement Solutions: Take account offriction loss at pulley shaft Increase friction loss between belt and pulleys Outcome from improved model Ratio: High (0.407) Input torque: 80Nm Calculated Movable pulley Measured Slide keys Fixed pulley Pulley shaft w/ clearance Resin bush
Permanent deformation of tension band From heat aging Clearancebetween tension band and block = At final period of belt lifespan: • Decrease transmitting efficiency • Belt temperature rise
Effect of permanent deformation power loss +18 % 1.45kw 1.72kw Vehicle speed 60Km/h with belt speed 30m/s with belt speed 35m/s Final period of lifespan Calculation result of clearance vs. transmitting efficiency
At high speed range Increase clearance Decrease efficiency Efficiency lowed within 1% Power loss +18% Belt temperature rise Effect of permanent deformation
At the period of lifespan Crack at lower sideof tension bands Dynamic FEA Calculate lower side strainat higher belt speed Dynamic strain analysis crack
Strain peak at tension pulley Period of contact with tension Pulley Strain Peak in dynamic behavior Ratio:High (0.407)Low (2.449) Strain Bending Strain 0 Belt speed: 35m/s 9.7m/s
Strain analysis at tension pulley Strain by dynamic behavior proportional to Belt Speed squared 12 11 10 9 8 7 6 下コグ表面歪み(%) 5 4 3 2 1 0 0 5 10 15 20 25 30 35 40 ベルト速度(m/s) Strain in dynamic behavior calculated strain Tension band strain(%) Bending strain S=0.00177*V2+7.96 Belt speed(m/s)
Crack failure S-N curve Belt temperature rise Strain (%) Belt speed increase Number of cycles to crack
Based on S-N curve and calculated strain Full agreement Decrease velocitylonger belt life Prediction of belt life Belt temperature :130deg C Experiment Calculated Experiment Calculated 35m/s 30m/s
Factors to affect transmitting efficiency: Pulley shaft clearance Permanent deformation of tension band Friction loss = Lower efficiency at high belt speed Raise belt temperature Shorten belt life Dynamic strain at high belt speed Shorten belt life Keys to success Cooling system Limit the maximum belt speed Conclusions